By Nick Bond
Regular readers of our newsletter are quite familiar with the usual temperature and precipitation patterns across Washington state during winter. On the regional scale there are notable differences between the maritime conditions prevailing west of the Cascades, and the more continental conditions on the east side. There are also smaller-scale variations, especially relating to the terrain and proximity to water. A variety of resources are available to track down how temperature and precipitation has played out in the historical record at different stations in WA (the climate office is happy to help here if needed). But many weather variables of interest and importance are not as readily accessible. A good example this time of year is the wind chill temperature, i.e., how cold it feels when you account for temperature and wind. There are locations such as Olympia Airport and Arlington Airport in the Puget Sound basin that are often colder than other spots nearby, especially during calm, clear winter nights favoring the formation of strong surface-based inversions. But these locations don’t necessarily have lower wind chill temperatures, since wind chill also depends on wind speeds. Since intervals of particularly low wind chill temperatures mean increased risks of hypothermia, let’s take a closer look.
We got the wind chill data below using the “Hourly-Observed Data” and then “Sub-Daily” and “Threshold Search” options, from the cli-MATE application maintained by the Midwestern Regional Climate Center (MRCC; https://mrcc.purdue.edu/CLIMATE/). The wind chill values compiled by MRCC use the National Weather Service definition (https://www.weather.gov/safety/cold-wind-chill-chart). The wind chill temperature is more sensitive to changes in the wind at lower speeds. For example, with an air temperature of 15°F the wind chill temperature decreases by 12°F as the speed increases from 0 to 10 MPH; an additional increase in speed to 20 MPH results in a further drop in the wind chill temperature of only 5°F. And once the wind speed gets to about 40 MPH, further increases in speed yield only minor decreases in wind chill temperatures (though in those situations perhaps the primary concerns are due to the wind itself!).
We focus here on the number of hours during the past cool seasons (October to March of 1997-98 through 2023-24) with wind chill temperatures below specific thresholds. We selected the threshold of values less than 20°F for the west side of WA, and examined the records for Hoquiam, Olympia, Sea-Tac and Bellingham; for the colder east side we selected a threshold of 10°F and looked at Pasco, Wenatchee, Pullman, and Spokane International Airport. It turns out that hourly wind chill temperatures in the MRCC database do not extend as far back into the past as other meteorological variables. This means these time series are better for looking at year-to-year variability rather than long-term trends.
To set the stage, we first provide some information on the mean winter climate of the 8 WA stations considered here. Table 1 below shows the average daily minimum temperature for winter (Dec-Feb), the average coldest minimum temperature of the year, and the single lowest hourly temperature recorded, all for the 30-year period of 1991-2020 that is generally used to represent current climatological norms. For good measure, we also throw into Table 1 the single lowest wind chill temperature for the winters of 1997-98 through 2023-24, recognizing that this record starts and ends later than that used for the other metrics.
While the east side of the state has average winter minimum temperatures that are roughly 5-10°F colder than those on the west side, the discrepancies are much more striking in the extremes. On the east side, typical annual minimums run about 15-25 degrees colder, and the very lowest temperatures are something like 20 to 35 degrees colder. There is a similar discrepancy in the extreme wind chill temperatures, where the eastern WA stations have values about 20 to 30 degrees colder. An exception to the balminess characterizing western WA is Bellingham, which often experiences strong northeast winds during its coldest weather, when cold air flows from interior Canada through the Fraser river valley. And Wenatchee stands out a bit on the east side. Its low value of -20°F is actually well above the other three east side stations even though its typical wintertime low temperatures are comparable. Apparently when it gets really cold in Wenatchee, the winds tend to be light. The severe cold snap during the second week of January 2024 featured the lowest wind chill temperatures at five out of eight of the stations examined here, with the other three having values that were close to their extremes dating back to the late 1990s.
Finally, on to the main event. Figure 1 shows the number of hours (October-March, 1997-98 through 2023-24) with wind chill temperatures less than 20°F at the western stations and less than 10°F at the eastern stations. The interannual variations in the duration of low wind chill temperatures are striking, especially west of the Cascades, where there can be over a 10-fold difference from one year to another. Here Bellingham is the clear winner, with an average of about 136 hours a season with wind chill temperatures below the 20°F threshold. Olympia and Hoquiam have the fewest number of hours, at about 30 per year, on average. Of the four stations considered in eastern WA, Spokane comes out on top with on average 167 hours a winter below the threshold of 10°F. Pullman is well behind Spokane, but has slightly more wind chill temperatures than Pasco and Wenatchee. The season of 2016-17 stands out in terms of wind chill for both sides of the state, with 2008-09 also prominent on the west side. Some of you may remember the latter, because of the crippling snowstorms that occurred in December 2008 throughout WA state, though the winter of 2016-17 was actually 2.5 degrees colder from a statewide perspective. And while such memories can be fleeting, the winter of 2016-2017 must have seemed harsh at the time; statewide average minimum temperatures were much higher in the two previous winters of 2015-16 and 2014-15, specifically by 7.9 and 9.4°F, respectively.
We conclude with the observation that over the short period analyzed here, the numbers of hours with low wind chill temperatures seem to be increasing. What’s up with that? Multi-year variations in winter conditions, particularly in the frequency and severity of cold air outbreaks is likely a factor – there happened to be a lull in the late 1990s and early 2000s. But we also suspect that there might be a role involving a change in measurement practices. More specifically, cup and vane anemometer systems were replaced by sonic anemometers in the middle to late part of the 2000s. The legacy Belfort cup anemometers were prone to icing in cold conditions and hence it is conceivable that there were calms reported when there were actually light winds at those times. Sonic anemometers have no moving parts and so are not subject to the same problem. Quantifying the net effect(s) of past changes in wind measurement practices is way beyond what we can do in this newsletter, but we bring it up here as an example of the details that need to be considered when interpreting climate records.
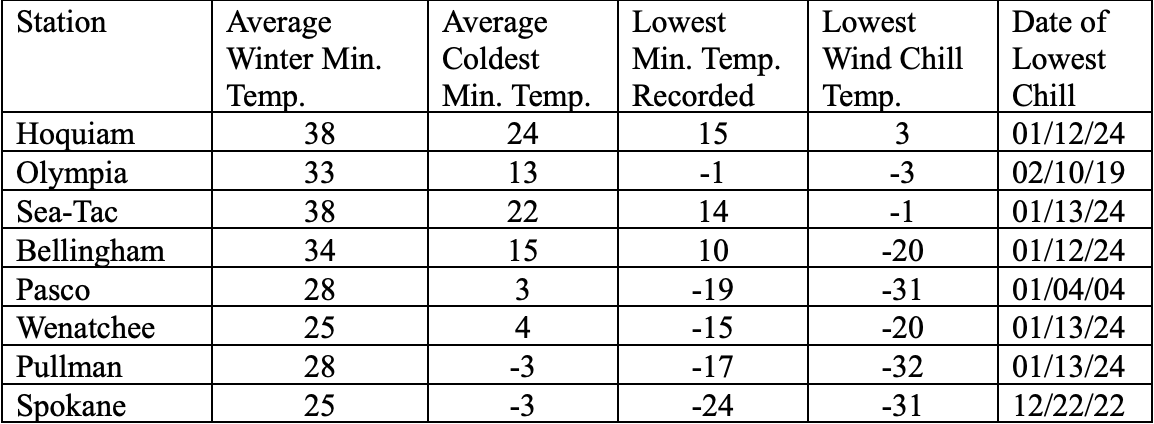 Table 1: Cold Temperature statistics (°F) for December-February in WA State.
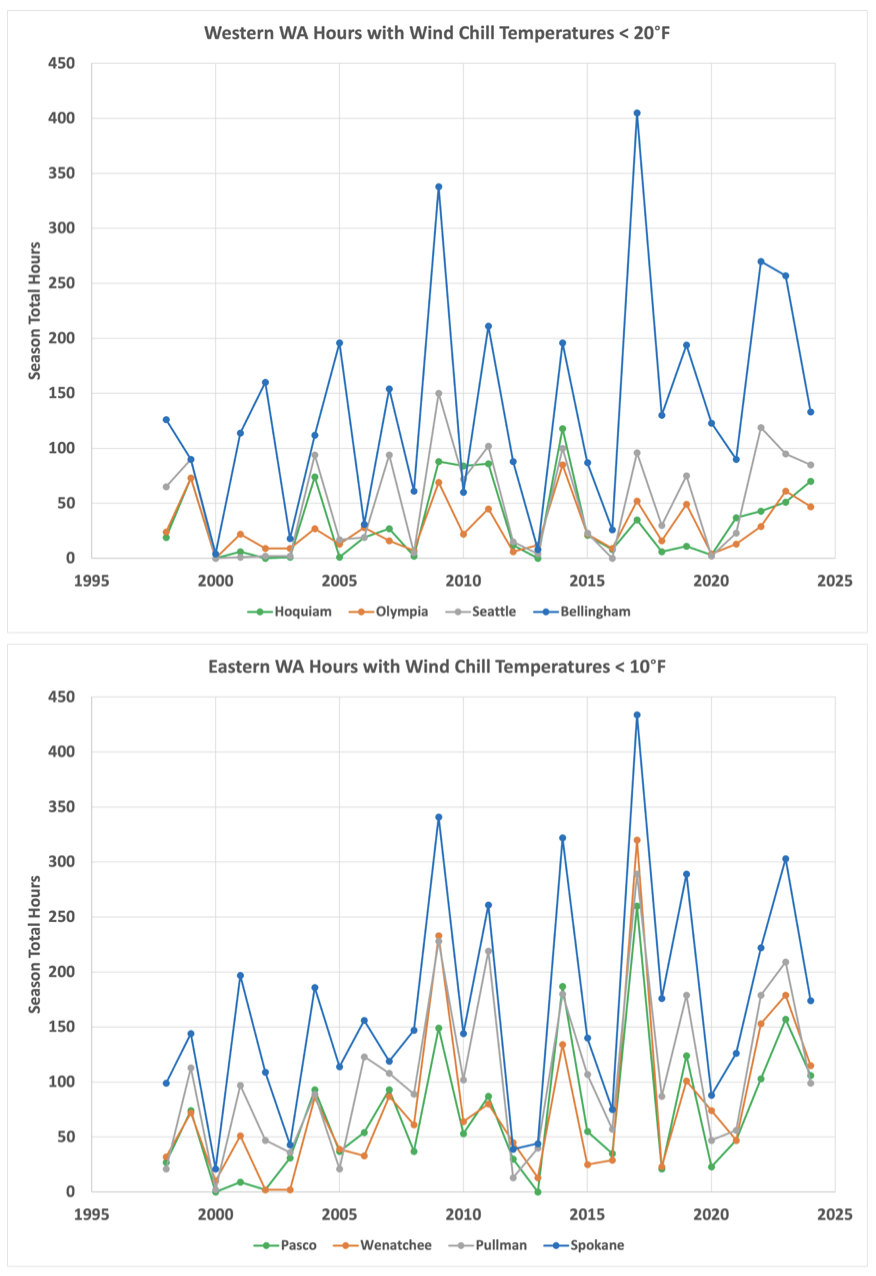 Figure 1: The number of hours with wind chill temperatures below 20°F (top) and below 10°F (bottom) for four western (top) and four eastern (bottom) locations. Data were compiled using hourly data from MRCC’s cli-MATE.