By Nick Bond
This is the time of year when it’s not just the climate geeks who are following what’s happening with our mountain snowpack. A range of audiences from winter sports enthusiasts to water managers are interested. In particular, many of us dread the warm and heavy precipitation events that intermittently visit the Pacific Northwest because of their potential to melt significant amounts of our cherished snow. The purpose of this month’s Climate Matters is two-fold: (1) to review a relatively recent article on projected changes in rain-on-snow (ROS) risks in western North America (Musselman et al. 2018), and (2) to take a peek at the impacts of particularly intense precipitation events on snow water equivalent (SWE) values, using historical daily data from an assortment of SNOTEL locations in WA state.
The paper by Musselman et al. relies on high-resolution (4 km horizontal grid spacing) Weather Research and Forecasting (WRF) model simulations of daily ROS events for 2000-2013 compared with climate change simulations looking at 2071-2100. WRF is a weather model that can be used for either forecasting or climate studies. The authors used ERA-Interim reanalysis data to provide inputs to the model. The future simulations are based on the so-called pseudo-global-warming (PGW) method, where the model inputs (ERA-Interim) are adjusted based on projected changes in climatic conditions (in this case: monthly average temperature, moisture, etc.), based on an average of 19 climate models. The paper does not focus on the accuracy of the WRF results, but does state that the WRF simulations yield ROS patterns and intensities that are similar to what is observed.
The results from the two sets of WRF simulations show that the expected changes in ROS vary significantly across western North America. In particular, they show a decrease in the frequency of ROS events at lower elevations, and an increase in their frequency at higher elevations. More intense ROS events are projected at higher elevations, with consequences for downstream flooding, but these increases are due to heavier rain in the future, not greater snowmelt during those events. Admittedly, there is a lot more to dig into in the Musselman et al. paper; we encourage you to have a look for yourself.
Musselman et al. define an ROS event with flooding potential to be a day requiring a precipitation value of at least 10 mm (0.39 inches), a pre-existing snowpack with a SWE of a least 10 mm, and a snowmelt contribution of at least 20%, compared to the total water (precipitation + snowmelt) produced in the event. The first two of these thresholds seem rather modest by some standards; our most impactful ROS events include daily precipitation values on the order of 100 mm (~3.9 inches) and higher, falling on snowpacks with SWE values also much higher (in the 100s of mm and more). In part for that reason, we decided to analyze heavy precipitation events and their association with changes in SWE, along with air temperature.
We extracted data using the Report Generator application maintained by the Natural Resources Conservation Service (NRCS). We downloaded daily data from 9 SNOTEL stations in WA state: Calamity, Spirit Lake and Spencer Meadow in the southwestern Cascades, Elbow Lake, MF Nooksack and Beaver Pass in the northwestern Cascades, Stampede Pass in the central Cascades, and two locations in eastern WA: Touchet in the Blue Mountains of SE WA and Moses Mountain in Okanogan County. Figure 1 shows a map with the locations of the SNOTEL stations. We picked the clusters in the southwestern and northwestern portions of the Cascades to get a look at small-scale variations in the response of SWE to heavy precipitation.
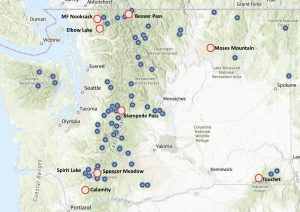 SNOTEL stations in WA with the sites used here labeled with white circles with a red outline (NRCS).
We extracted daily data, for SWE, average air temperature, and precipitation. The temperature and precipitation values are for each day as a whole; the SWE is the value at the start of the day. We focused on 2-day intervals of heavy precipitation, recognizing that precipitation events can be both shorter and longer than that. In situations when consecutive days had total 2-day precipitation that met the threshold for a “top” event (this happens when there is a single day with really high precipitation), we selected only the latter 2-day period so as not to double count a single event. We also restricted our analysis to events in which the final SWE value was 2 inches and greater as a crude means to avoid including events during which more snow could have melted if it was there in the first place. The final dataset also included only periods where all three variables were available (precipitation, SWE, and temperature), which means some periods of heavy precipitation are not reflected in the composites. Finally, the data records from these stations as made available through NRCS are of varying lengths. All extend back at least 20 years (MF Nooksack and Beaver Pass have the shortest records) and some go back to the 1980s. For consistency’s sake it could be argued that it would be preferable to use a common period of analysis, but since our interest was in the most intense events, it seemed reasonable to use the full records at each station.
Our analysis focuses on variables associated with the top 20 precipitation events (matching the criteria listed above) as summarized in Table 1 below. Perhaps the most interesting findings are in the 4th column that lists the means and standard deviations in the 2-day changes in SWE with the 20 top 2-day precipitation events. Note that the trio of Calamity, Spirit Lake and Spencer Meadow in the southwestern Cascades are the only stations that lose SWE on average, and these losses tend to be modest relative to the amount of precipitation. In other words, the run-off during these events is predominantly due to the precipitation itself, not snowmelt. Examination of individual events shows that daily average air temperatures of roughly 35°F represent the transition from increasing to decreasing SWE over the 2-day events. The air temperature of this transition does appear to depend on the amount of pre-existing SWE, with greater SWE values tending to result in less melting at air temperatures in the high 30s (°F) and above. But this effect is mostly manifested only at the stations of Spirit Lake, MF Nooksack, Stampede Pass and Touchet. It makes sense that the latter three stations demonstrate this effect since they tend to have greater snowpacks; it is unclear why Spirit Lake is also part of this group and may just be a fluke. The eastern WA stations of Touchet and Moses Mountain tend to have increases in SWE that are large relative to precipitation amounts as compared with the western stations that tend to have greater extreme precipitation amounts. This makes sense since Touchet and Moses Mountain are cold with even relatively heavy precipitation often falling in the form of snow. The correlations between the air temperature and change in SWE shown in the right-most column of Table 1 are more or less consistent among the various stations. A negative correspondence between these variables is expected in warmer places where it often switches between rain and snow, even in winter.
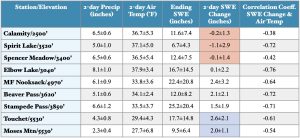 Table 1 Summary Statistics for Top 2-Day Precipitation Events. All but the right-hand column show the average and standard deviation for the top 20 precipitation events with at least 2 inches of SWE remaining afterwards. The right-hand column shows the correlation between the 2-day changes in SWE and 2-day air temperatures for the top 20 precipitation events at each location.
As is typically the case with these pieces, the results summarized here are by no means complete and definitive. Our simple analysis includes a number of arbitrary, untested assumptions and selections that allowed us to take a first look. Nonetheless, it does seem clear that heavy precipitation events do not necessarily lead to declines in our snowpack, at least in terms of SWE and at the higher elevations typical of SNOTEL sites in WA state. And there are intriguing differences between short-term SWE changes at the various stations considered that do not appear to be simply related to elevation. Given their importance, there’s plenty of reason to continue to explore and further our understanding of the factors controlling our regional snowpack.
Reference:
Musselman, K.N., F. Lehner, K. Ikeda, M.P. Clark, A.F. Prein, C. Liu, M. Barlage, and R. Rasmussen, 2018: Projected increases and shifts in rain-on-snow flood risk over western North America. Nature Climate Change, Vol. 8, 808-812. https://doi.org/10.1038/s41558-018-0236-4