Late August Climate Outlook

What’s Next for the Pacific Northwest?

Short Term: Persistent Heat Likely Through Early September

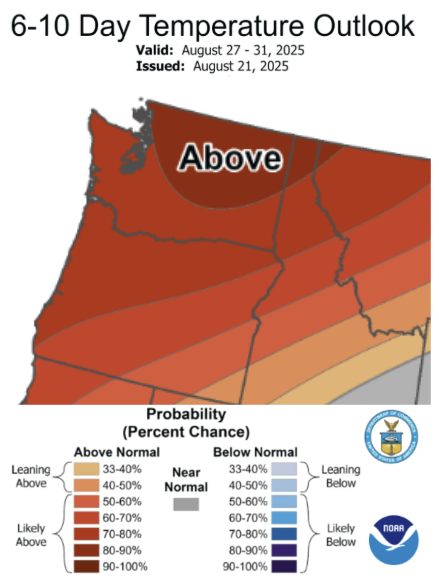
Dangerous heat is building across the Pacific Northwest this week and into the weekend. Warmer than normal temperatures are also expected to persist over the next couple of weeks, as illustrated in the Climate Prediction Center 6-10 Day Temperature Outlook below. There is a 70-90% chance of warmer than normal temperatures from August 27-31, 2025 across the state. Above normals temperatures are expected to continue through at least the first few days of September 2025.

Expect periods of impactful late-summer heat through this period, and consult National Weather Service forecasts, watches, and warnings for up to date current information and local forecasts.

alt=""
August 27-31 CPC Temperature Outlook Map.

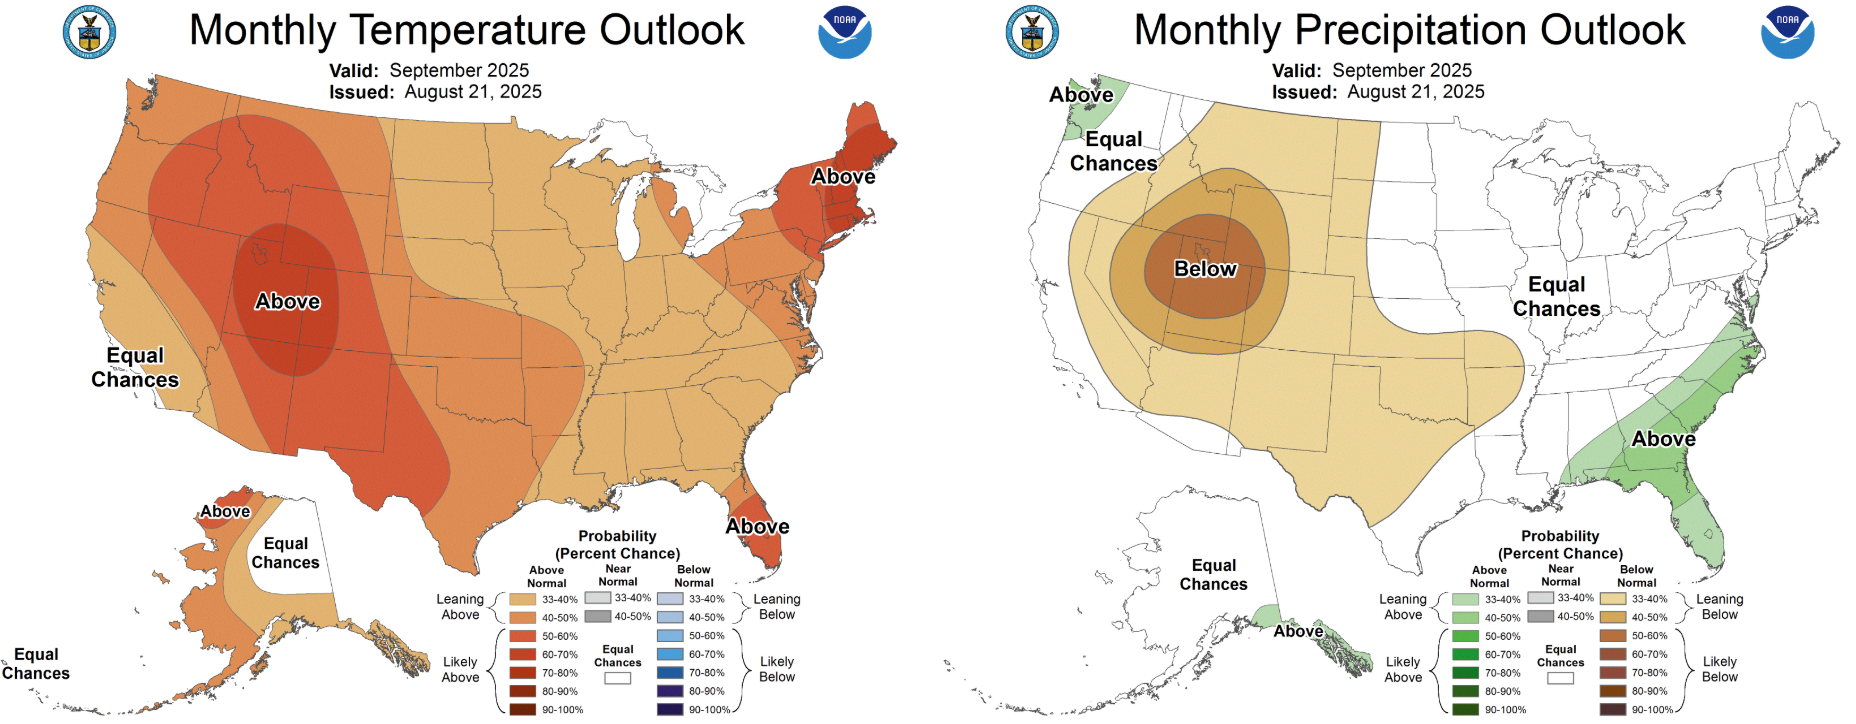
Warm conditions are likely September through November statewide with a slight chance of wetter than normal conditions across western Washington

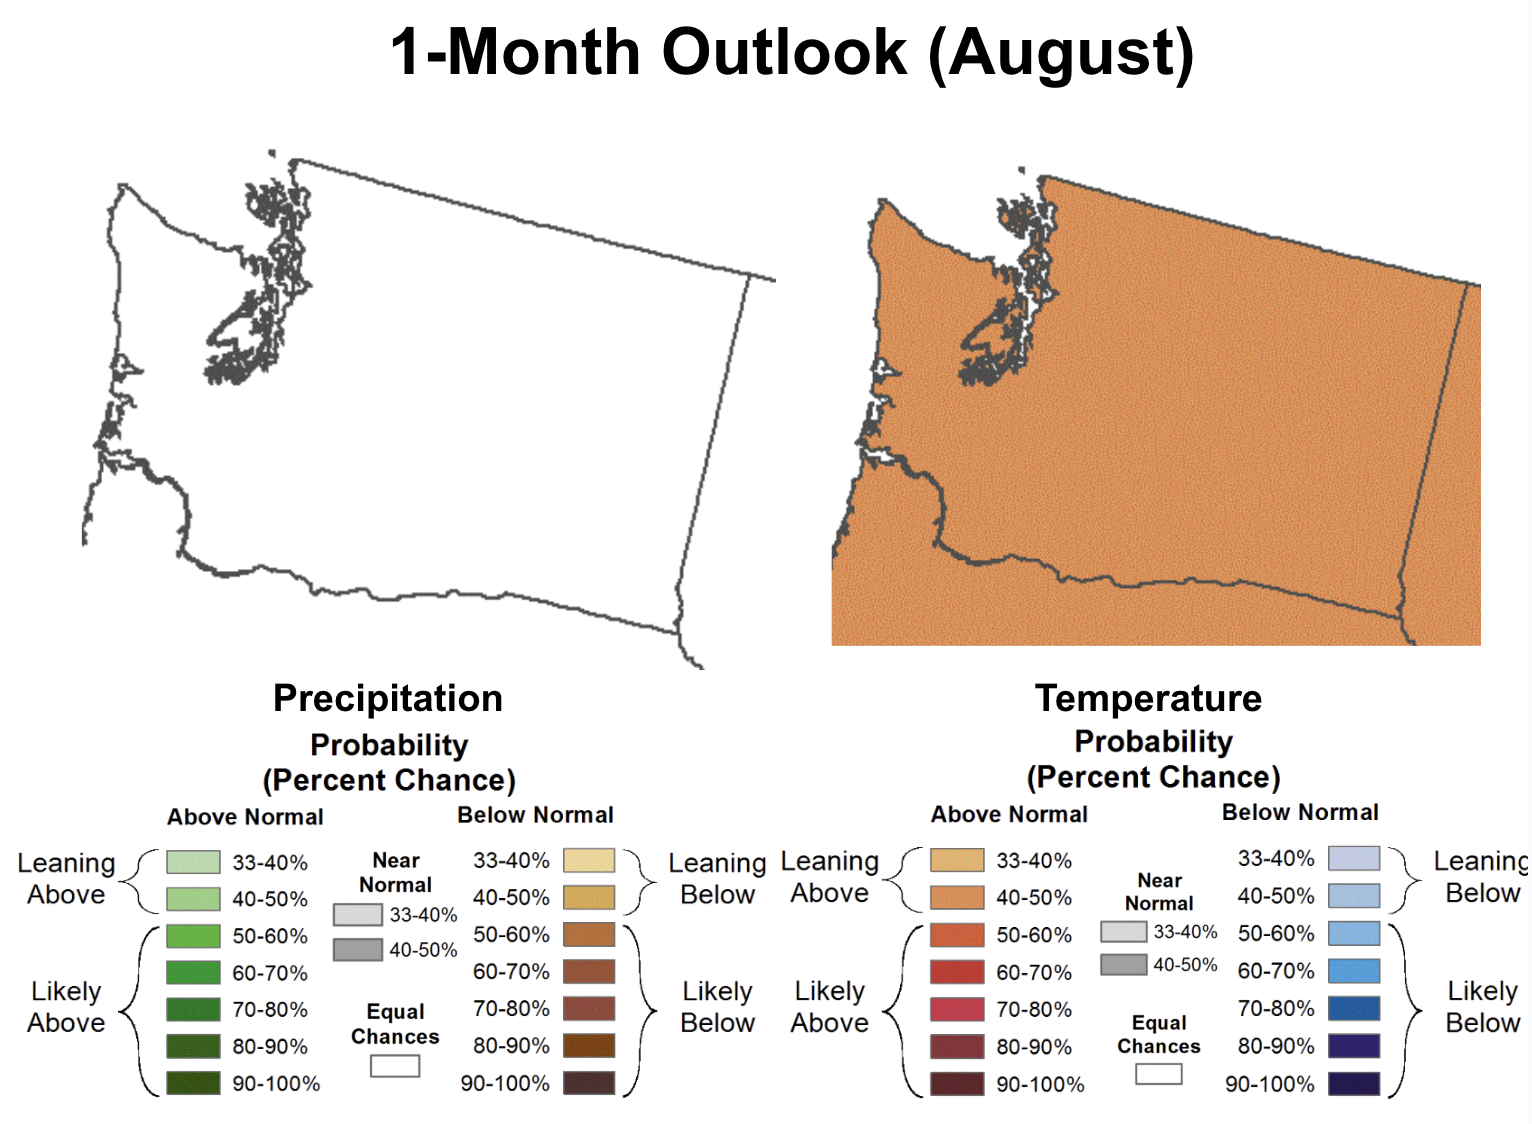
The Climate Prediction Center’s monthly outlook for September 2025 shows elevated chances of warmer than normal temperatures with a slight lean toward wetter than normal conditions across western Washington. Temperatures are most likely to be above normal (50-60%) across the far southeastern corner of the state with a slightly lower chance (40-50%) of above normal temperatures across the rest of the state.

Much of the state is expected to have near normal precipitation in September, but western Washington has a slightly higher chance (33-40%) of wetter than normal conditions. This is due to a more active pattern in mid-range climate models that tends to allow for some early season precipitation to work its way into the state from the Pacific.

alt=""
September 2025 CPC Temperature and Precipitation Outlook maps.

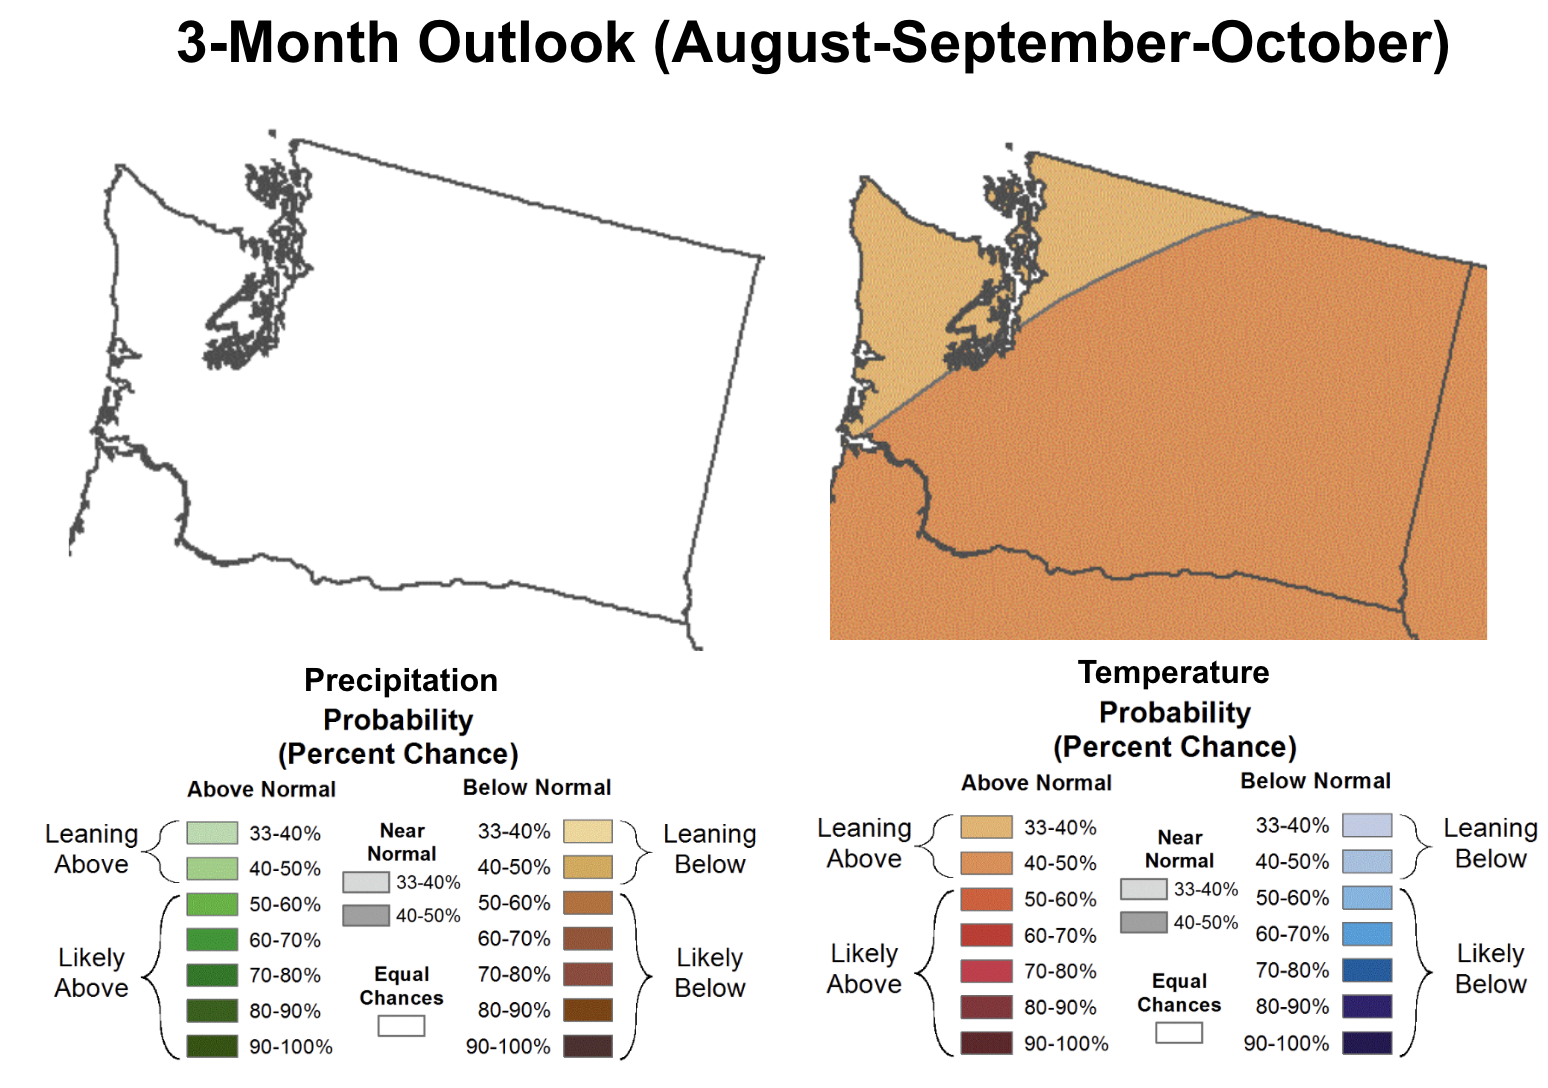
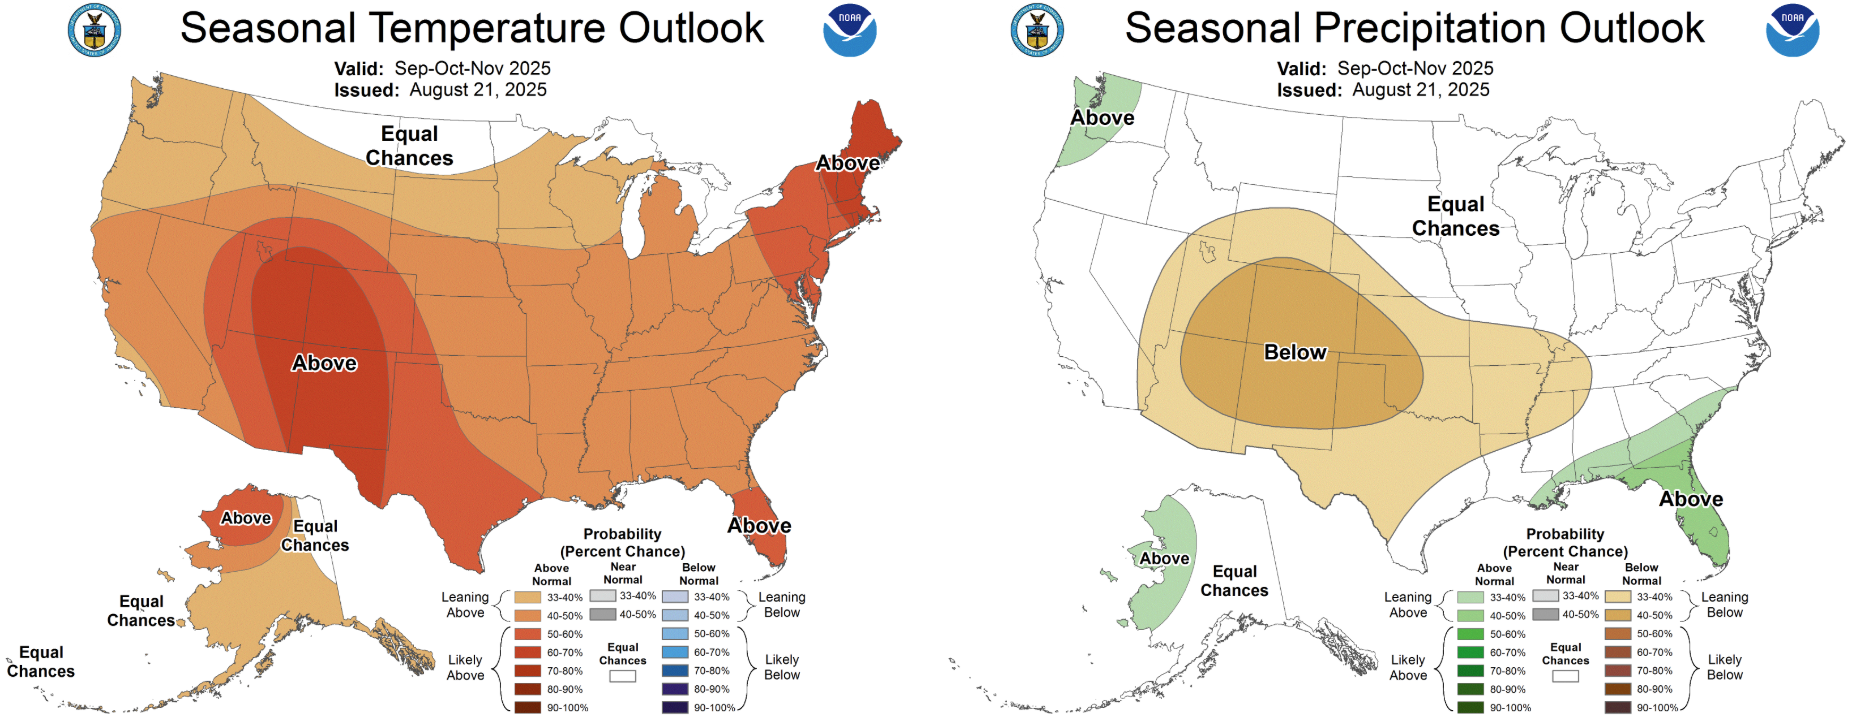
Looking out a bit further, the seasonal forecast for September through November paints a similar picture. Statewide, there is a slight chance (33-40%) of above normal temperatures although chances of warmer conditions are much higher across the interior west, southern, and eastern United States. As for seasonal precipitation, there is a slight chance (33-40%) of above normal precipitation across the western half of Washington as we enter the cool and wet season. This is largely driven by the expected development of a weak and brief La Niña event this fall and winter, discussed below.

alt=""
September-November Seasonal CPC Temperature and Precipitation outlook maps.


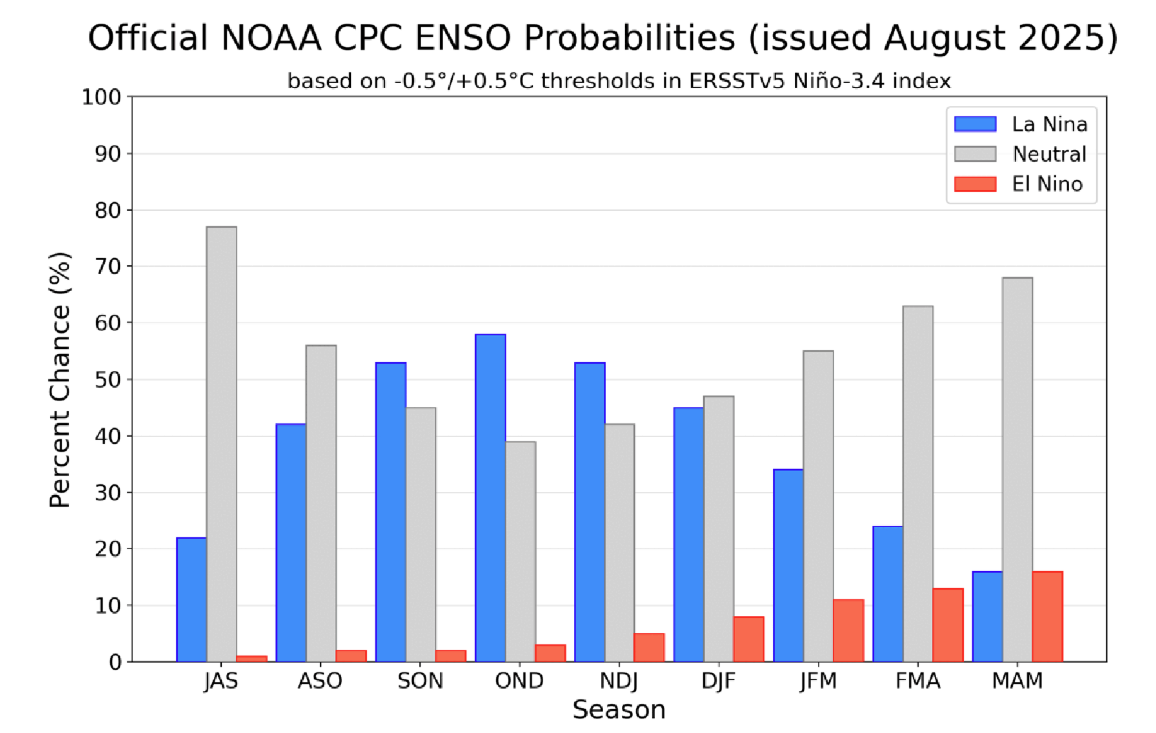
La Niña watch issued for Winter 2025-2026

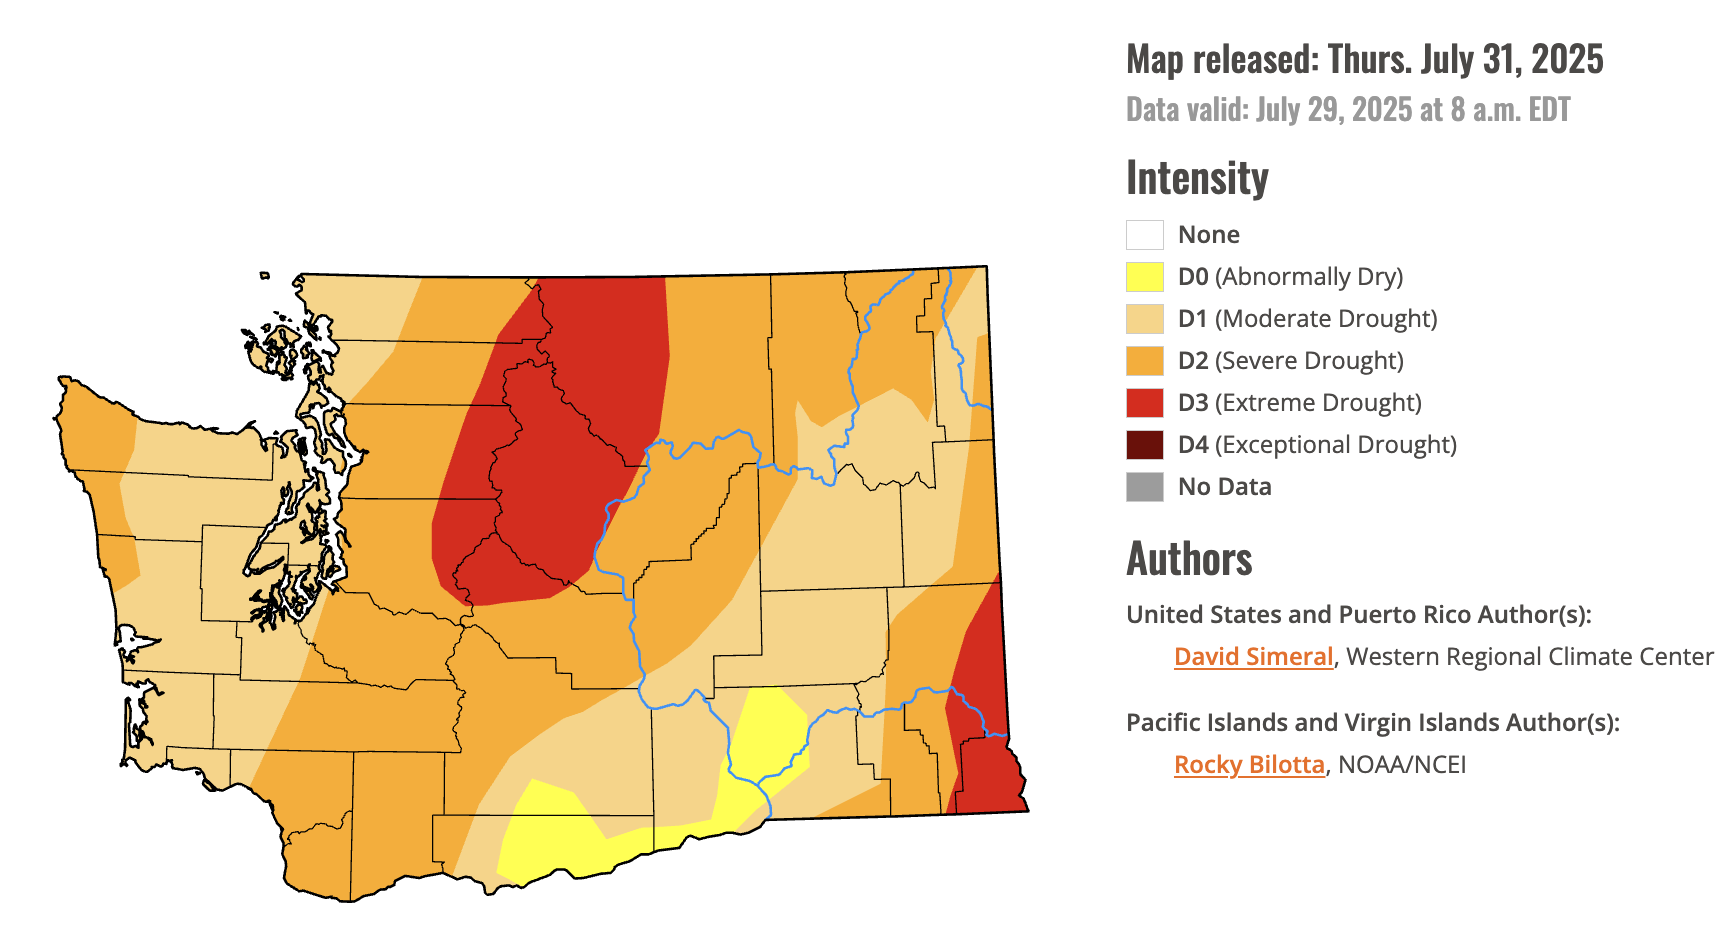
The Climate Prediction Center/NWS has issued a La Niña Watch for the upcoming cool season, indicating that conditions are in place for the development of La Niña conditions in the Tropical Pacific sometime over the next several months. This La Niña event is expected to be similar to last year in that it will be a rather weak and brief event with conditions likely returning to neutral status by late winter or early spring. There is now around a 55-60% chance of La Niña conditions by early winter, around a 40% chance of neutral conditions, and a less than 5% chance of El Niño conditions. Like all years, natural year-to-year variability remains larger than the influence of ENSO on our regional climate, but La Niña conditions tend to coincide with slightly cooler and wetter than normal conditions for the winter season. This is cautiously optimistic news considering the level of Severe to Extreme drought currently gripping the state.

alt=""
Official ENSO Forecast from the CPC from July 2025-May 2026.

Our Afternoon Heat Comes Later

Editor’s note (08/13/2025 4:30pm): Time of day was previously shown in standard time on the graphs below, in error. The graphs and text are now updated to Pacific Daylight Time. 

One of the things I really appreciate about living here is how late it stays light out. I moved to Seattle from San Diego in 2008 (I know, another Californian), and that shift in latitude made a huge difference in the length of the day. Of course, the days are also much shorter in winter here, but I enjoy the variety.

Even though they might go hand-in-hand, I hadn’t thought until recently about how our afternoons seem to stay hotter later than what I’ve seen elsewhere. I decided to take a look at it for this month’s newsletter. The plot below shows the average temperature for each hour of the day for June-September, at airports across the country (if you’re wondering about June gloom, I also tried July-Sept and got basically the same answer). I’m looking at airports because those often have the longest observational records, especially for hourly data. 

alt=""
Average hourly temperature for select US cities from June-September. Hour zero corresponds to midnight local daylight time.

Of course, the first thing that jumps out is that these other cities are much warmer than us, both at night and during the day. And I’m only showing temperature here – if we add in humidity and look at the heat index, the differences are even more striking, especially for Miami. 

The other interesting thing is the timing of the warmest temperature of the day. Since the averages can sometimes mask important variations, I’ve included a box plot showing the range of timing for the daily maximum temperature. You can see that there’s a lot of variation, but most events stick to a consistent pattern. For all of the other cities, the hottest temperatures tend to happen between 12 and 3pm local time (hours 12-15 on the graph). But for Seattle, the hottest hours of the day are between 3 and 4pm (hours 15-16). The timing of this late-afternoon heat also tends to be a bit more consistent in Seattle, as shown by the narrower range in the boxplot for Sea-Tac compared to the other cities.

alt=""
Range in daily timing of peak summer temperature in select US cities.

(A quick technical side note: This is in local daylight savings time. Some locations are further west or east within their time zones, which can skew the results. If we wanted to get really precise here, we would be looking at solar time, or sun angle. Since this detail can only shift things by plus or minus roughly 1 hour, we’re sticking to time zones for simplicity.)

Back to the bigger question: Why? Why does the heat linger through our afternoons when it doesn’t do the same elsewhere? Humidity isn’t the only explanation, because it’s pretty dry here – especially compared to the other locations. This is actually pretty surprising, because in general we expect temperatures to stay hot longer when there’s more humidity – water vapor is a greenhouse gas, so it suppresses cooling. Another possibility is that we’re surrounded by water, and water takes longer to heat up. This is probably part of the story, but Spokane’s afternoons are hot later too, just like Seattle’s. So the maritime effect can’t be the only explanation (side note: the weather at Sea-Tac can often be different than in Seattle, and there are likely variations in afternoon heat timing across Puget Sound; we didn’t look at those for the current analysis). Another factor is cloudiness. In spite of our gloomy reputation, our summers are gloriously sunny (especially compared to our winters). But in other places, especially east of the Rockies, summer is a time of thunderstorms. The timing and intensity varies from place to place, of course, but often the pattern is that clouds build into the afternoon. Clouds don’t always bring rain, but they always bring shade – causing temperatures to moderate. This is probably a major factor for the New York, Miami, and Colorado stations. West of the Rockies summer thunderstorms are not as common, mainly because our slice of the Pacific Ocean is much cooler than the Gulf of Mexico and eastern seaboard. So for LA the explanation is different: it’s the shorter days. Like I said at the start, we’re way farther north than southern California, and our longest day of the year is almost 2 hours longer than for LA. Finally, where we sit in our time zone can also make a difference – see the maps here for the bizarre effects of our meandering time zone delineations on sunset timing.

This leaves us with the somewhat complicated takeaway that there are several factors at play: afternoon clouds are likely important east of the Rockies, length of day is a factor, maritime influence both suppresses thunderstorms and delays afternoon warming, and where we sit in our time zone could skew things slightly.

One of the reasons we want to understand the cause for this kind of thing is curiosity. Another is to know if we should expect changes under certain conditions, or over time. Since the main factors for Seattle are our proximity to Puget Sound and our latitude, we don’t expect these to change much over time. Below I’m showing a plot of the peak heat timing at Sea-Tac since 1948 (the average line is smoothed with an 11-year moving average just to make it more readable).

Average timing of peak afternoon heat at SeaTac 1949-2024

There appears to be a slight shift to later times over the course of the record, but the change is small and likely not statistically significant. So based on our sleuthing about the cause, and with the observational data to back it up, we don’t expect this to change much over time – our late afternoon heat is here to stay. Either way, keep in mind that on really hot days you’ll need to find ways to stay cool through the late afternoon. And when it’s not too hot, enjoy it while we’re still in summer!


Early August Climate Outlook

ENSO-neutral conditions are likely to continue through October according to the Climate Prediction Center (CPC). Neutral conditions make it more difficult to predict upcoming fall conditions. There are roughly equal chances of either La Niña or neutral ENSO conditions for the upcoming winter, with much lower chances of El Niño conditions.  

The 1-Month August outlook indicates low predictability for precipitation with equal chances of above, below, or near-normal precipitation, shown by the lack of shading. Above normal temperatures are expected to continue through August with a 40-50% chance of above normal temperatures statewide. 

alt=""
1-month (August) outlook for precipitation (left) and temperature (right) in Washington State.

Similarly, the 3-Month outlook (August-September-October) also shows equal chances of above, below, or near-normal precipitation. As for temperatures, above normal temperatures are favored to continue from August through October with a 40-50% chance of warmer than normal temperatures across much of the state and a 33-40% chance of warmer than normal conditions across the Olympic Peninsula, the far northern Cascades, and the central and northern Puget Sound.

alt=""
3-month summer (Aug-Oct) outlook for precipitation (left) and temperature (right) in Washington State.

July 2025 Climate Summary


July precipitation as a percent of 1991-2020 normal.
alt=""
July mean temperature anomalies relative to 1991-2020 normal.

July was the fourth consecutive month with below normal precipitation statewide in Washington. Statewide, July 2025 was the 22nd driest month since 1895 with an average of only 0.27” of precipitation. Large portions of the state received less than 30% of normal precipitation including nearly all of western Washington and the central and southern Columbia Basin, as seen in the dark brown shading on the map above. Large portions of the I-5 urban corridor received either very little or no precipitation including just a trace of precipitation in both Olympia and the Seattle Weather Forecasting Office and 0.00” in Vancouver, WA for the month.

On the coast, Quillayute and Hoquiam received only 34% and 9% of their normal July precipitation, respectively. Crucially, key agricultural areas in the state including Yakima, Sunnyside, Prosser, and the Tri Cities also received well below normal precipitation. Dry conditions also occurred in Spokane (17% of normal), Ephrata (3% of normal), and Pasco (0% of normal) as well. The table below lists select stations where recorded precipitation fell within the top 10 driest July totals on record. Stations are listed in descending rank order. 

alt=""
July 2025 precipitation rankings, in descending order, for select Washington stations.

Thunderstorm activity on the higher terrain of northeastern Washington and the Cascades brought scattered areas of near-normal precipitation along with a few very isolated pockets of above normal precipitation, as seen in the blue-greens on the map. These storms brought with them the threat of lightning and were much too isolated to improve the overall statewide drought situation.  

Mean temperatures for July were well above normal statewide. Statewide, July 2025 was the 12th warmest July in Washington since 1895. Across much of western Washington, mean temperatures were around 1-3°F above normal including +2.2°F at Seattle WFO/NWS, +1.3°F at Olympia, and +1.7°F at Vancouver. Larger anomalies of about 3-5°F occurred in the Olympics. Eastern Washington experienced temperatures around 1-4°F above normal including +2.5°F at Spokane, +3.5°F at Wenatchee, and +1.9°F at Ephrata. Minimum or overnight temperatures were also particularly warm around the Yakima Valley with localized areas experiencing temperatures +5.0-7.0°F above normal.  The only areas with just below or near normal temperatures in the state were along the Pacific Coast and shoreline of Puget Sound where cloud cover related to the marine layer tended to keep temperatures cooler than normal during the daytime. 

alt=""
July 2025 climate summaries for locations around Washington. Anomalies are relative to a climate normal baseline of 1991-2020.

The scatterplot below shows how statewide precipitation totals and temperatures in May-June-July 2025 have compared to previous years. This can provide helpful context towards illustrating just how dry and warm late spring and early summer were this year. The dark red circle on the scatterplot represents this year, and each separate point represents each year’s May-July period, with data back to 1979. The lefthand axis of the chart shows precipitation, and the bottom axis shows temperature.  The May-July 2025 period has been the 4th driest such period since 1895.

alt=""
Washington statewide average precipitation (y-axis) and mean daily temperature (x-axis) for May-July for 1979-2025. The dark red dot denotes 2025 values.

July 2025 Drought and Streamflow Update

Map of below normal streamflow nearly statewide.
Streamflow percentile, by hydrologic unit, for July 2025. Data from USGS Water Watch.

Streamflow continues to run well below normal in July 2025. The majority of basins are experiencing below normal (orange) or much below normal (red) streamflow. A few basins in northern Washington are experiencing record low flow. 

A 28-day graph of statewide runoff paints a similar picture of persistent and worsening hydrological drought this year.  Statewide runoff has been below the 10th percentile since mid-May 2025. Furthermore, runoff has worsened and is running under the 5th percentile as of August 1. This means that for the past 28-day period, roughly 95% percent of years have seen more runoff than in 2025. Runoff is now approaching record lows as of early August.

alt=""
Water Year 2025 28-day average runoff statewide for Washington.

Driven largely by below average precipitation and snowpack over the past 4 months as well as warmer than normal temperatures, drought has continued to worsen and expand. The U.S. Drought Monitor introduced Extreme Drought (D3, red shading) over the northern and central Cascades for the first time this year, representing a continued escalation of drought concerns.

alt=""
U.S. Drought Monitor for Washington. Data valid on July 29, 2025.

Extreme Drought now covers 14.4% of the state, the highest such percentage since the drought of 2021. Meanwhile, Severe (D2) and Moderate (D1) drought have also expanded to cover the vast majority of the state with only small portions of the lower Columbia Basin remaining at the lowest level of drought severity, shaded in yellow on the map above. 

Change in U.S. Drought Monitor Class from June 3-July 29, 2025.

Zooming out to a more regional view, drought has worsened over the past 8 weeks for virtually the entire Pacific Northwest. On this map of change in U.S. Drought Monitor class, yellows and oranges represent worsening drought conditions, and darker oranges represent areas that have seen drought conditions worsen significantly since June 3, 2025. Rivers, soils, forests, and people are all feeling the strain of drought region-wide.


July 2025 Notable Weather Events

Graph of SeaTac and Spokane daily high and low temperatures.
July 2025 daily high (red bars) and low (blue bars) temperatures as well as normal high and low (pink and light blue lines, respectively) for SeaTac Airport (left) and Spokane (right). Gray shading denotes weekends.

July brought frequent warm spells across the state. In western Washington, July 16 brought the hottest temperatures of the season so far for most. On this day, SeaTac reached a high temperature of 94°F, and Seattle Sand Point WFO reached 95°F, breaking the previous daily record at Sand Point of 89°F set on July 16, 2018. Quillayute also set a daily high temperature record on July 15 with a high temperature of 90 °F. Temperatures soared into the upper 90s in the Nisqually Delta and south toward Longview and Vancouver, WA as well. 

A relatively cool spell, as seen in the above daily temperature graph for Seattle (left) from July 17-27, was caused by near daily pushes of cool and moist air from the Pacific Coast into much of western Washington. Morning fog and low clouds were a consistent feature during this period, often clearing for inland areas by midday or early afternoon each day. 

alt=""
GOES Satellite imagery from July 25, 2025 at 7:51am PDT.

What causes this persistent layer of summer gloom, you might ask? Light southwesterly flow brought the marine layer and associated low clouds far into the interior of Western Washington. Satellite imagery from the morning of July 25 shows this coastal air clearly as low clouds settle into the Puget Sound lowlands and into the valleys of the Olympics and Cascades. 

This layer is often relatively shallow, so our mountains put on quite the show as they peek out above the cloud layer. Take a hike above this cloud layer and you’ll be rewarded with a sunny view of the cloud layer from above. 

On the morning of July 25, the marine layer was thick enough to bring mist and drizzle to Puget Sound. This humble drizzle served as the only measurable precipitation for the month for many locations; only around 0.01”-0.03” according to CoCoRaHS observations and did little to moisten soils. 

Precipitation observations around Puget Sound from the morning of July 25, 2025 due to marine layer drizzle. Data from CoCoRaHS and observers like you!

Across eastern Washington, which lacked the influence of a marine layer with low clouds, temperatures ran more consistently above normal with many locations observing temperatures around 2-4°F above normal. In the higher terrain of the Cascades, Okanogans, and Rockies, a more active period of instability during the latter third of the month brought repeat summertime thunderstorms and scattered beneficial rainfall along with the threat for lightning-induced fires. In particular, the afternoon and evening hours of July 21 and 22, two separate thunderstorm complexes brought rainfall to the North Cascades. Isolated and mainly dry thunderstorms then put on a show across northeastern Washington again on July 27 bringing a few tenths of an inch of precipitation to the outskirts of the Spokane metro. Storms returned on July 30 and 31 prompting flash flood watches from the NWS due to the threat for slow moving thunderstorms. Thankfully no significant flooding occurred. 

Although storms brought pockets of precipitation here and there, the most notable feature was actually a persistent lack of precipitation with most locations from the Puget Sound south toward Vancouver and much of the Columbia Basin recording well below normal precipitation for the month. Learn more in the statewide July 2025 Climate Summary. 

The Bear Gulch fire began near Lake Cushman on July 6 and then experienced rapid growth on the evening of July 29th. The fire grew to 5,126 acres by August 6th with containment of only 3%. Smoke and poor air quality impacts were felt across western Washington on August 4th as a result of this fire growth. The fire is believed to be human caused and has prompted road closures for a portion of FS-24 and nearby trailheads and campgrounds. Visit the Northwest Interagency Coordination Center for the most recent updates and information on this and other fires across the state. As fire season ramps up, stay up to date on burn restrictions and  information on outdoor air quality.