By Jacob Genuise
If you have lived in Washington for long enough, you are probably well aware that our dry and sunny summers end predictably around October or early November when fall rains and cloud cover move in. This enduring feature of Washington’s climate is not only important to upholding our internationally-recognized mysterious and moody PNW persona, but it also supports ecosystems (and us humans) that rely on and have adapted to this consistent and timely precipitation cycle.
If you weren’t quite ready to confront that truth of the impending fall rains as we make our way into September, I sincerely apologize… read on for more dry, sunny summer talk.
This summer has been particularly dry statewide with below normal precipitation in June and July, above normal temperatures June-August. This coupled with large precipitation deficits throughout the water year has led to statewide drought conditions. More than a few summers in the recent past have followed this same concerning dry pattern, and future climate projections also show evidence that our summers are likely to become drier in the future.
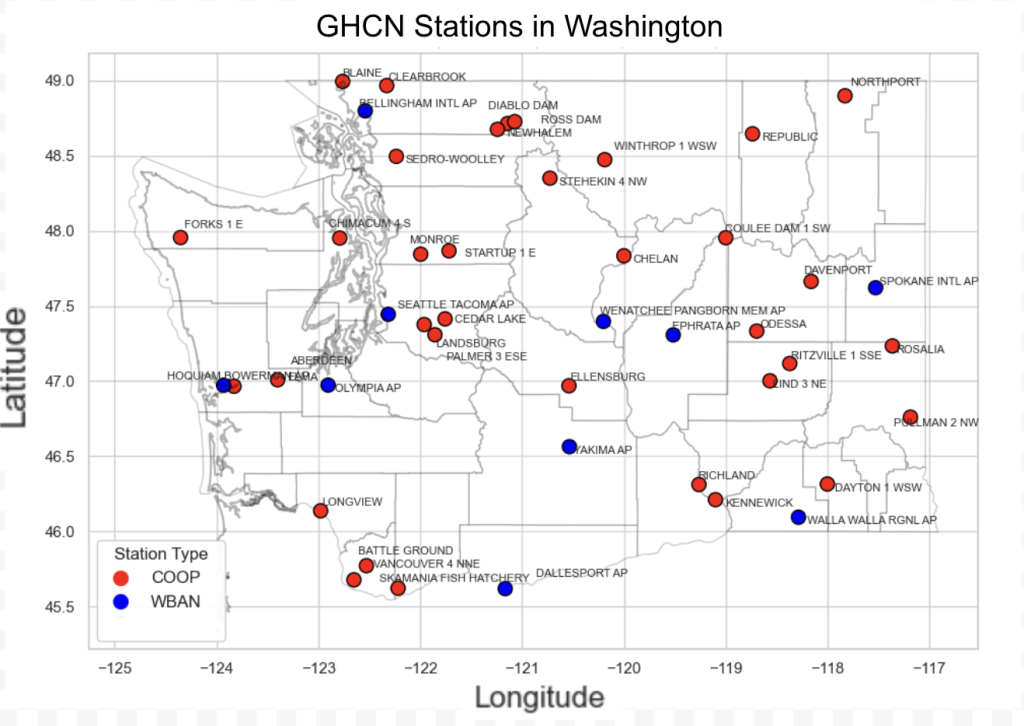 Map of select GHCN stations that met data completeness requirements for this analysis. There is decent spatial coverage across the state aside from a gap in the southern Cascades.
This made us curious as to what the longer term historical record says about the dry season in the Evergreen State. Since 1960, do you think our summer precipitation has changed? Have we seen more abundant summer rainfall? Or, do we tend to receive less frequent and abundant summer precipitation? Take your bets now!
To scratch the mere surface of answering these rather large questions, we performed a trend analysis on the daily precipitation record of 46 long-term climate stations across Washington from 1960-2024. These stations all belong to the Global Historical Climatological Network which is a rather valuable set of stations for climate scientists. This network’s data are checked rigorously to ensure quality so that it can be used to answer these kinds of long-term climate questions. We also performed some additional checks for data quality and record completeness for this analysis, but I won’t bore you with the details here. It bears mentioning that the analysis considers the trends at individual stations rather than WA state as a whole; statewide precipitation totals are disproportionately impacted by wetter regions (typically coastal and higher elevation locations) and the present treatment does not discount changes that have occurred in drier parts of the state.
To answer the question – Have there been changes to our summer dry season? – we looked at a couple of indicators. (1) Has total summertime precipitation changed in the Washington dry season? (2) Have the total number of dry days in a season changed?
The answer appears to be yes. From 1960-2024, the vast majority of stations show a decline in total precipitation (around 5-10% decline per decade relative to 1991-2020 normals) and an increase in the number of dry days from July-September (0.5-1.5 days per decade). Note: We chose July-September here since these are typically our driest three months of the year, but these trends hold for the typical June-August meteorological summer definition as well. Statistically significant trends are identified visually on the maps by the larger dots, and a count of statistically significant trends is also included in the table in the lower righthand corner of each map.
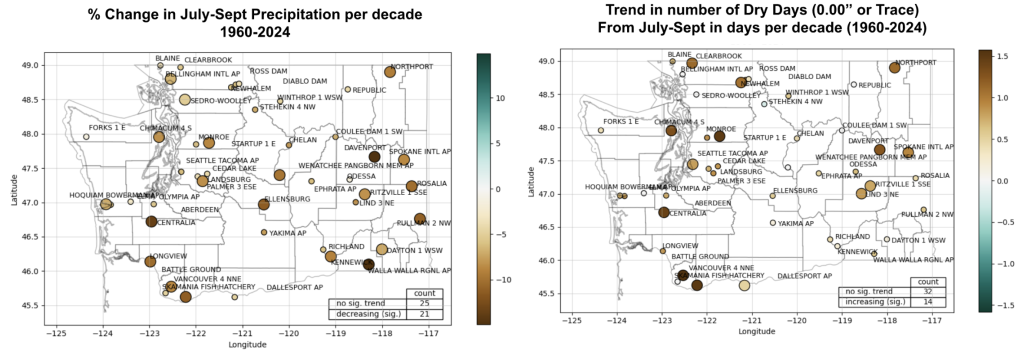 Change in July-September total precipitation (left) and the total number of dry days July-September (right). Larger dots represent statistically significant trends.
A respectable number of these trends are statistically significant, and even amongst the trends that are not statistically significant, the vast majority of stations show declining summer precipitation in both frequency and amount. Declines are also present across nearly the entire state.
Whoa, well wait just a minute! (Part 1): Aren’t these stations all at lower elevations near population centers? What about our mountains and higher elevation parts of the state?
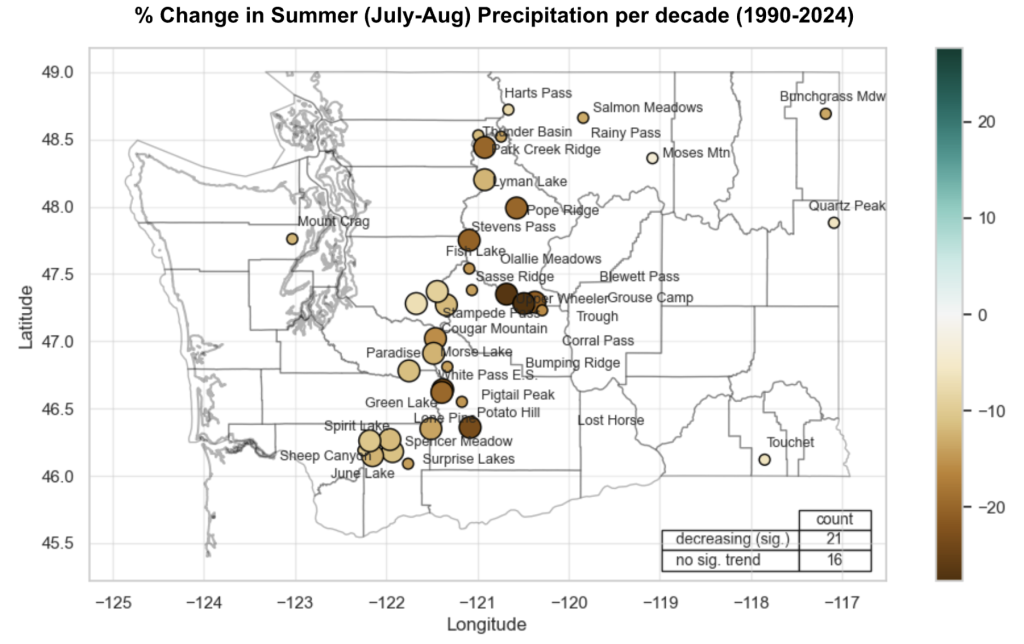 Percent change per decade in summer total precipitation for SNOTEL stations from 1990-2024. Large dots represent significantly significant trends.
Luckily we have a wonderful set of Snow Telemetry (SNOTEL) stations scattered around the higher elevations to help us answer this question. It is important to note that SNOTEL stations were largely installed in the 1980s, so this map is based on trends from 1990-2024. These high-elevation stations show a very similar trend with a decline in summer (here July-August) precipitation of around 10-20% per decade over this period in these high-elevations SNOTEL stations.
Whoa, well wait just a minute! (Part 2): Isn’t choosing 1960 as a start date rather arbitrary, and therefore may bias results? Absolutely! Let’s check to see if this trend holds when we use different start dates. And, let’s look at trends across other seasons and for the year as a whole.
These boxplots below represent all of the trend values in total summer precipitation across the state. Each separate group of boxplots represents a seasonal time period, and each separate box represents trends when calculated across different time periods. For example, in each boxplot group, the leftmost box corresponds to trends calculated from 1960-2024, the next box to the right represents 1970-2024, and so on through 1990-2024 in the fourth box. The rightmost box in each group then represents the period 1990-2024, but only for SNOTEL (high elevation) stations.
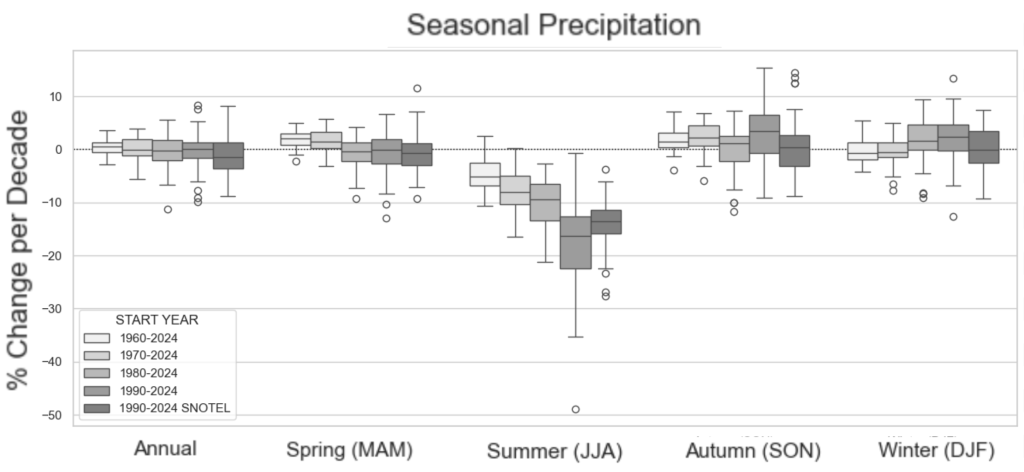 Distribution of trends for all WBAN, COOP, and SNOTEL stations. 1990-2024 period represents both WBAN and COOP and a separate box plot of SNOTEL sites only. Plot includes trends for all stations, regardless of statistical significance. Boxes represent the middle 50% of data and the center line represents mean trend across all stations.
In the middle of this chart, the Summer period (here summer is defined as the typical meteorological summer June-August) boxplots shows declines in total precipitation no matter what the chosen start date was for the analysis. These declines also seem to accelerate when calculated over more recent periods. This could either be because summers are actually drying at a more rapid rate in the recent past compared to the more distant past, or simply that a start date of 1960 happened to be a relatively dry* period in the long-term record. We would need to widen our record out even further back to check this, but unfortunately station-based precipitation data is much less abundant before the 1960s.
It is also interesting to note that, at least from 1960-2024, there has been no notable trend in total precipitation in the other three seasons or on an annual basis.
Although our summer rains may be becoming less abundant and frequent, one thing is absolutely certain, fall rains will arrive in the next couple of months… so break out those rain boots and find a way to enjoy them, and be advised it might be a good idea to check for spiders inside them first!
* a previous version of this article noted the opposite, in error. A slight wetting trend in summers from 1960s-1980s could be contributing to the accelerating trend noted above over this period.