By Jacob Genuise
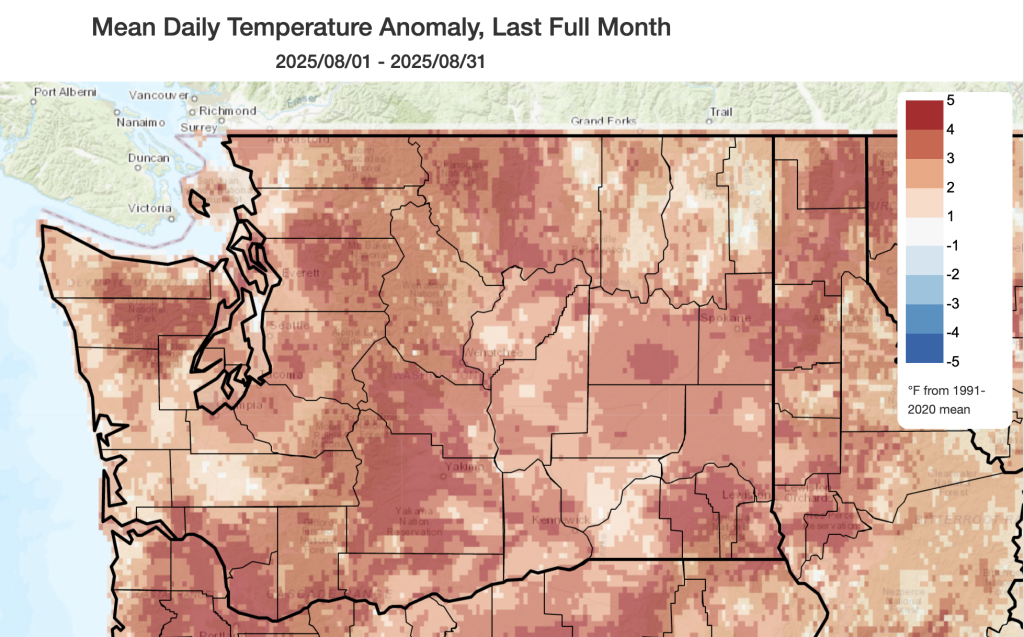 August 2025 mean temperature anomalies relative to 1991-2020 normal.
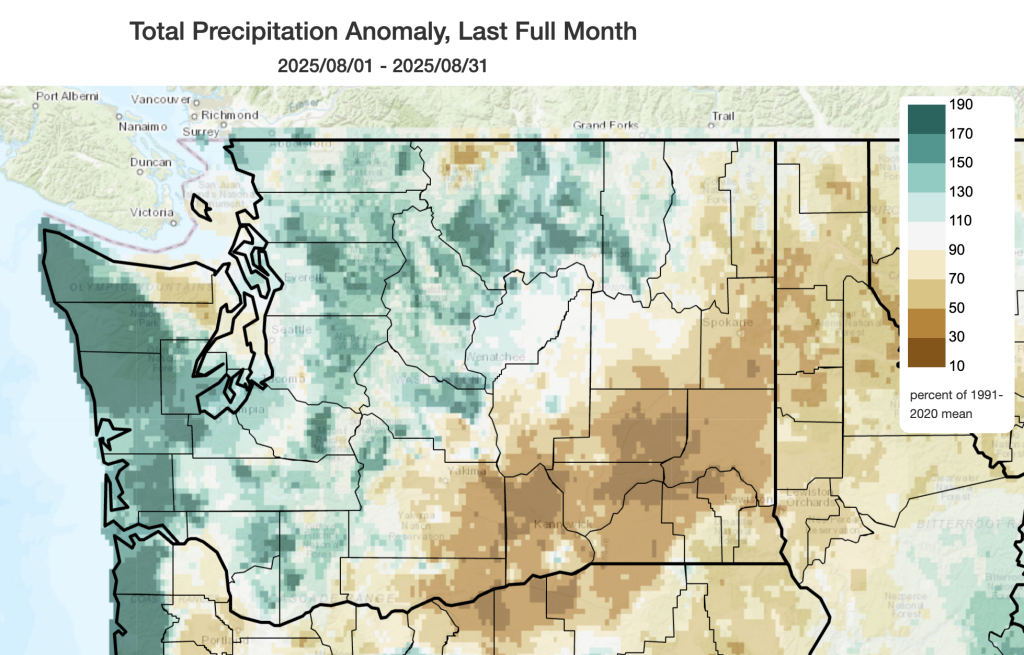 August 2025 precipitation as a percent of 1991-2020 normal.
Temperatures tell a consistent story across the state with warmer than normal conditions present statewide. Temperatures were well above normal across virtually the entire state. August 2025 was 2.8°F above the 1991-2020 normal statewide, ranking as the 4th warmest August since 1895 (tied with August 1962), and the warmest since August 2022. Temperatures were 2-4°F above normal for most population centers including Hoquiam (+2.0°F), SeaTac (+1.4°F), Spokane (+3.2°F), and Pasco/Tri Cities (+2.7·F) with a few spots approaching +6°F above normal.
The table below shows August 2025 temperature rankings at select airports across the state including the 4th warmest August in Vancouver (since 1997) the 5th warmest August in Yakima (since 1947) and an impressive 9th warmest August in Spokane (with records back to 1881). Many of the warmest areas of the state, relative to normal, were in very remote areas where there are few reliable, long-term weather stations. These record temperatures are therefore not represented in the table below.
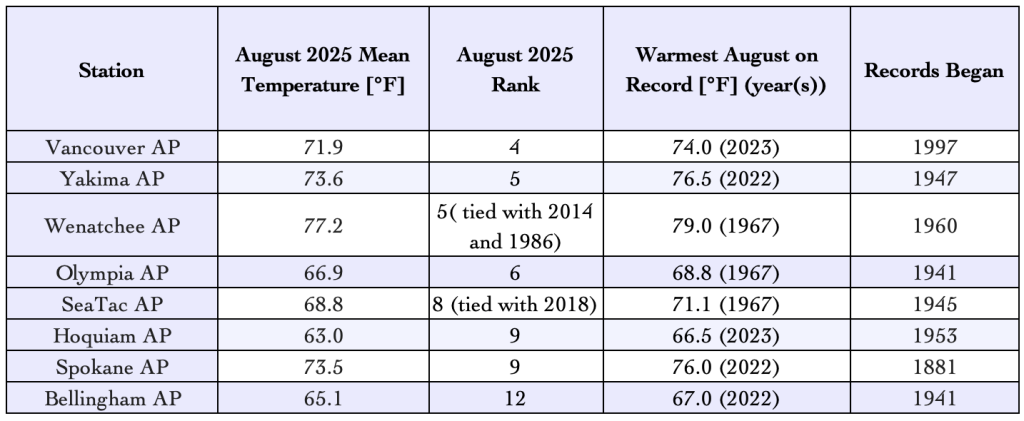 August monthly mean temperature rankings for select Washington airports, in descending rank order.
Minimum (overnight) temperatures remained particularly warm throughout the month, and even during relative lulls between heat waves overnight temperatures struggled to drop below seasonal normals. These warm temperatures come on the heels of above normal temperatures in June and July as well (see the seasonal summary below).
August brought wetter than normal conditions to the western portions of the state while drier than normal conditions continued in much of the Columbia Basin and far eastern Washington. In western Washington precipitation was above normal due largely to a single, unseasonably wet atmospheric river event from August 14-16. CoCoRaHS stations near the coast, and the windward slopes of the Olympics and Cascades received 3-6” during this event alone. Anomalies for the month of August came in around 100-150% of normal for many locations around Puget Sound including 116% of normal in Olympia, 152% of normal in Hoquiam, and 148% of normal in Bellingham for the month. In the windward Olympics and coastal areas, monthly anomalies were as large as 200-250% of normal. This mid-month rain event helped to push rain totals in the Cascades to near or above normal for the month as well.
Portions of the northeastern and east-central Cascades also received some convective thunderstorms throughout the month which led to very localized downpours. A few lucky spots received well above normal rainfall including 296% of normal in Omak (0.80” compared to 0.27” normal) and 239% of normal in Ephrata (0.43” compared to 0.18” normal). Given how dry August is typically, even modest thunderstorm rainfall in these spots can produce well above average precipitation. Statewide, precipitation averaged out to near-normal.
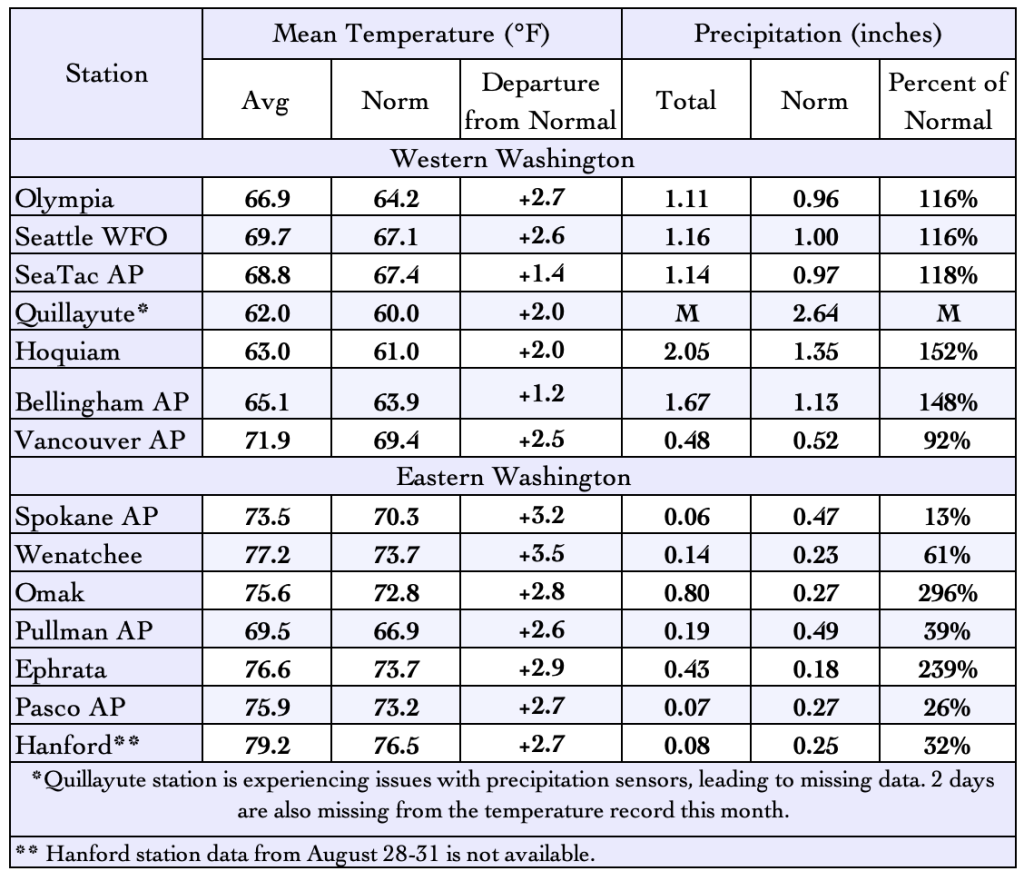 August 2025 climate summaries for select locations around Washington. Anomalies are relative to a climate normal baseline of 1991-2020.
In contrast, across the Columbia Basin from Yakima through the Tri Cities and east toward Spokane and Pullman, rainfall was below normal to much below normal. Many of these locations observed only 20-60% of normal precipitation for the month. Below and near-normal precipitation also occurred in the far northeastern Skelkirk and Kettle Mountains where thunderstorms over dry fuels ignited numerous fires late in the month.
Summer 2025 Summary
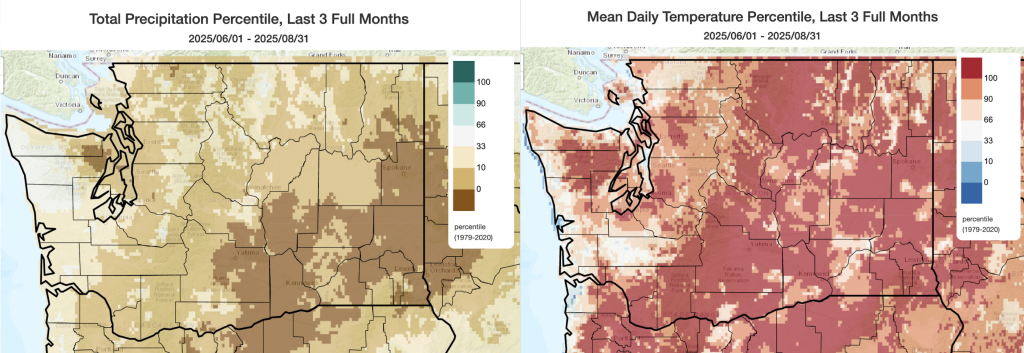 Summer 2025 (June-Aug) precipitation (left) and temperature (right) percentiles relative to 1979-2020. The darkest brown (red) shading represents record dry (warm) conditions.
Summer 2025 (June through August) has been dry and warm statewide, as shown by these maps of precipitation and temperature percentiles. Darker colors on both maps show areas that received much below normal precipitation or much above normal temperatures. Dark brown and dark red shading shows areas with record low precipitation and record high temperatures, respectively, over the summer 2025 period. Summer 2025 (June-August) was the 4th warmest summer statewide since 1895 and the warmest since the summer of 2021. Summer was also the 7th driest since 1895 and the driest since summer 2017.
By this measure, the driest conditions occurred across the Columbia Basin with record low summer precipitation near Yakima, The Tri-Cities, Spokane, Pullman, and Walla Walla. Record low precipitation also occurred in the rain shadowed areas to the northeast of the Olympics and in portions of the southeastern slopes of the Cascades. An impressive amount of the state also experienced record warm temperatures this summer, indicated by the large swaths of brick red shading on the map above. Many of these record warm temperatures also occurred in areas with record low precipitation across south central and southeastern Washington. There were small areas of near-normal temperatures near the coast and in the Chehalis River Basin where persistent marine layers kept temperatures a bit cooler despite hotter conditions inland.
Warm temperature departures were particularly impressive in terms of minimum (overnight low) temperatures. Rapid warming in overnight low temperatures is a well-documented trend globally as well as in Washington State. From 1874-2023, statewide daily low summertime temperatures have warmed by about +3.35°F. This is more than double the observed +1.42°F of warming in statewide summertime high temperatures over the same period (WASCO Trends Tool Data Source: NOAA HCN Dataset). This summer is a good example of this kind of accelerated nighttime warming.
Graphs of daily low temperature departures at SeaTac and at Spokane International Airport show the vast majority of overnight temperatures this summer were above each station’s long-term normals. These long-term normals are based on each station’s individual periods of record, which are longer than our typical 30-year 1991-2020 period. In SeaTac, only 21 days had a below normal low temperature (blue bars) compared to 71 days with an above normal low temperature (red bars). In Spokane, there were only 12 out of 92 days this summer with below normal low temperatures. The tables to the right of each graph show the top 10 and bottom 10 days with largest warm and cool departures respectively. This pattern of warming summertime nighttime temperatures is expected to continue.
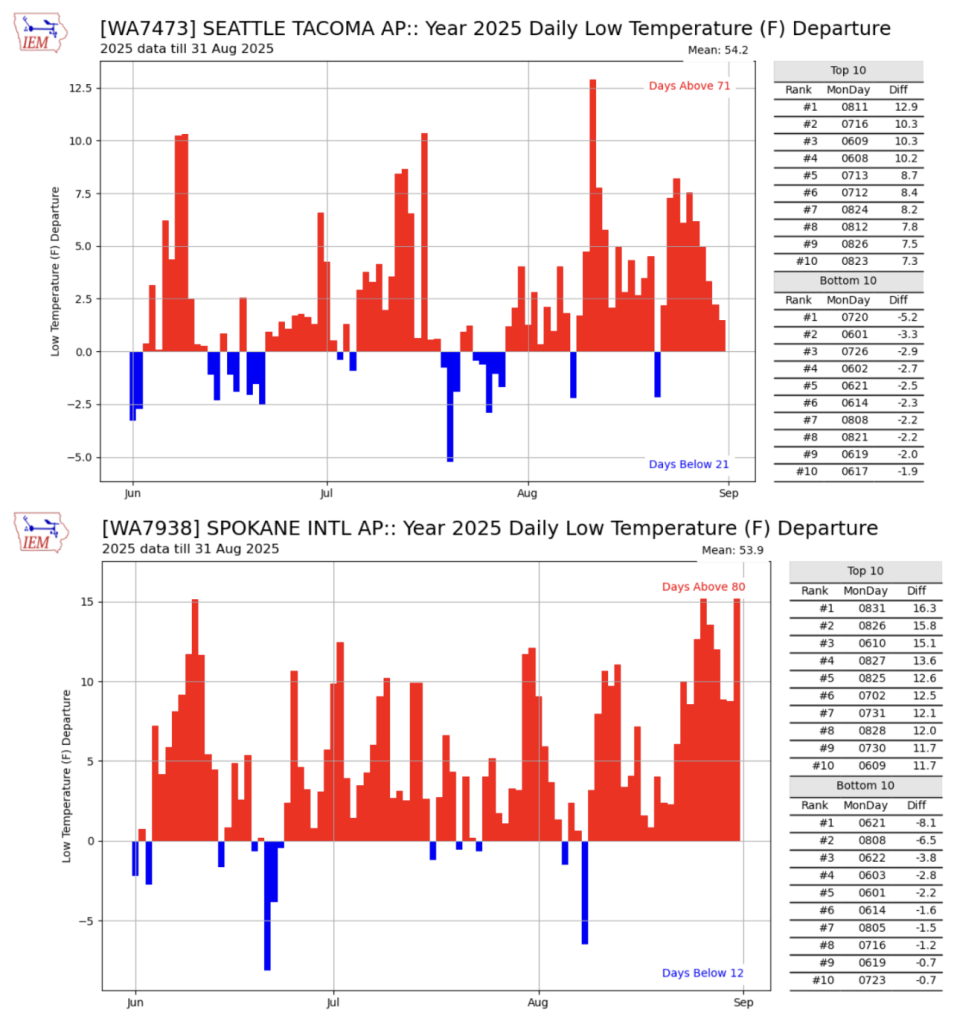 Daily low temperature departure from long-term averages at SeaTac (top) and Spokane International Airport (bottom) for summer 2025 (June-August). Departures are relative to the station’s period of record (Spokane: 1881-Present. SeaTac AP: 1945-Present).