By Jacob Genuise
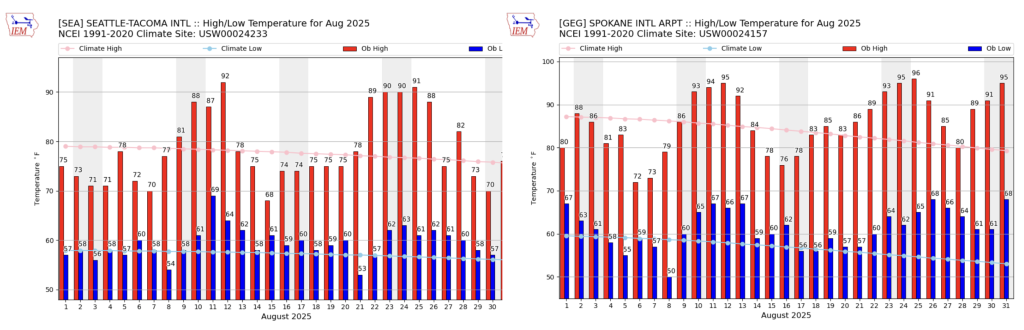 August 2025 daily high (red bars) and low (blue bars) temperatures as well as normal high and low (pink and light blue lines, respectively) temperatures for SeaTac Airport (left) and Spokane (right). Gray shading denotes weekends. Normals are based on the period 1991-2020.
August was a warm month characterized by notable heat waves statewide, a rare summertime atmospheric river rain event in the middle of the month, and isolated thunderstorms across the high terrain and across eastern Washington. Heat waves from August 9-13 and 21-26 brought well above normal temperatures statewide as high temperatures rose into the 90s across western Washington and the upper 90s to over 100 in the Columbia Basin. On the 11th, the Dallesport Airport recorded a high temperature of 105°F, their highest temperature of the month, although well behind Dallesport’s daily record high on 8/11 of 110°F during the June 2021 heat wave. On the 13th, Pasco/Tri Cities Airport recorded a high of 102°F, just below the daily record of 104°F set in 2004. Seattle Sand Point tied the daily high record of 93°F on the 12th, and Vancouver, Washington experienced their highest temperature of the month and set a daily record high on the 23rd with a high temperature of 100°F (prev. daily record was 95°F in 2000). Minimum temperatures were especially warm throughout the month with most stations recording above normal overnight low temperatures consistently. Read more about these warm overnight lows in the Summer 2025 Climate Summary below.
Above average temperatures and limited precipitation this summer have also led to high fire concerns statewide. The Bear Gulch Fire, burning to the west of Lake Cushman on the Olympic Peninsula, began on July 7 and smoldered for weeks before burning much more intensely in late July through mid-August. The fire progression map below shows the area burned by this fire through September 3. The color shading on this map corresponds to the date in which that shaded area burned, so large areas of the same color indicate a time period with rapid fire spread. Blue shading shows progression through mid-July in which there was relatively minimal fire spread near Lake Cushman. The fire then spread rapidly in late July into early August, shown in the large area of orange shading. Dry and breezy conditions around August 11-12 then caused fire to burn further westward and along south-facing slopes, shown by light red shading on the map. Additional expansion along mainly southern slopes occurred through late August, shown in dark red shading.
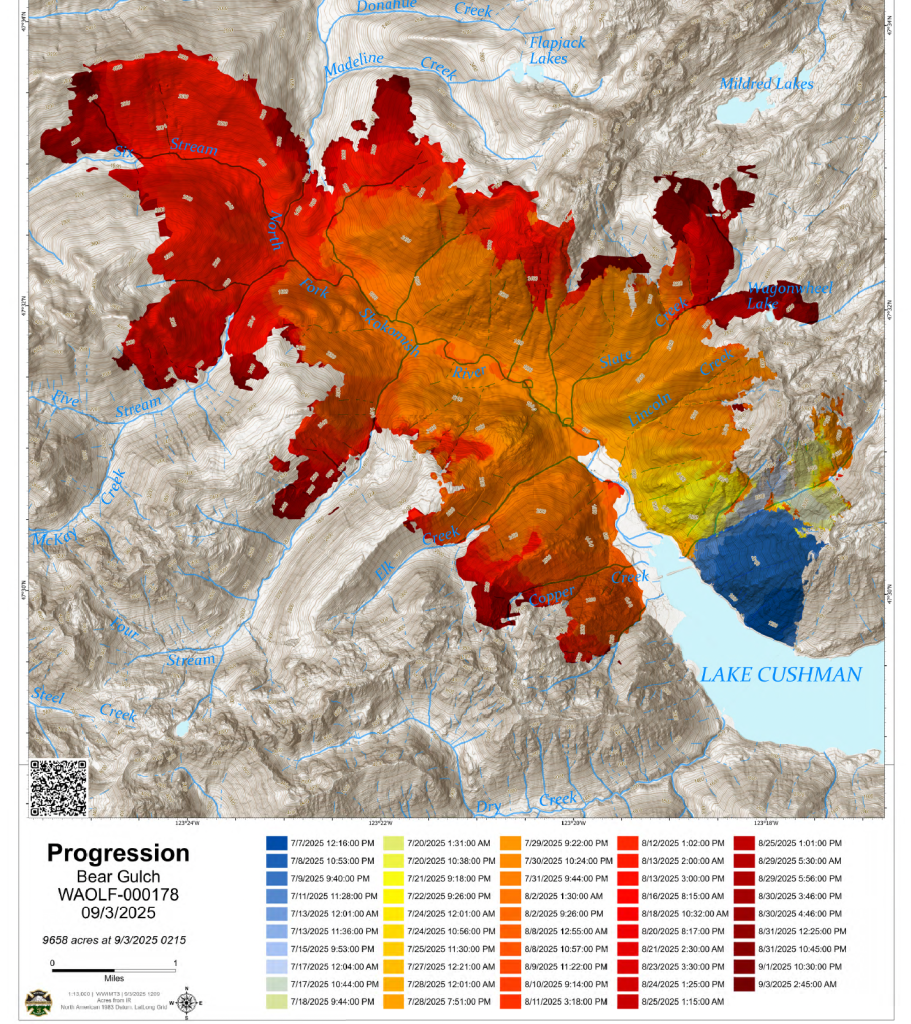 Bear Gulch fire progression map from July 7 through September 3rd, 2025 near Lake Cushman.
Thankfully, a rare summer atmospheric river event arrived August 14-16 and helped to limit fire spread and temporarily decrease fire risk statewide. This atmospheric river ranked as a medium intensity storm (AR level 3 out of 5 on the Atmospheric River scale by the Center for Western Weather and Water Extremes). This chart shows the frequency of atmospheric river rainstorms by month of the year, beginning with October on the far left. The taller the bar, the more frequent atmospheric rivers are in that month, and August is among the months with the lowest frequency for storms in Washington. We typically begin to see these wetter storms beginning in late September or October, but rarely in mid-August.
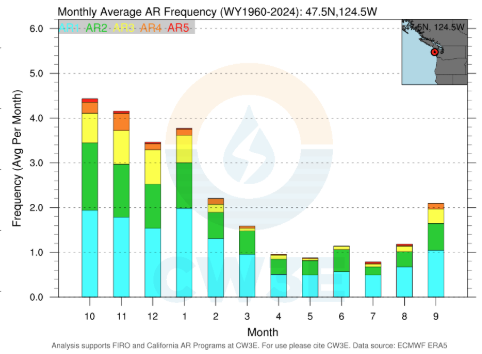 Atmospheric river frequency climatology from the Center for Western Weather and Water Extremes. Shading corresponds to AR Intensity.
Rainfall totals ranged from generally under 0.50” across eastern Washington, 0.50-2.00” across the western Washington lowlands, and 3.00-6.00” in the windward slopes of the Cascades and Olympics. This rainfall fell on largely dry soils and caused a temporary increase in runoff across much of the state (read more about impacts of this event are available in the August 2025 Drought and Streamflow Update)
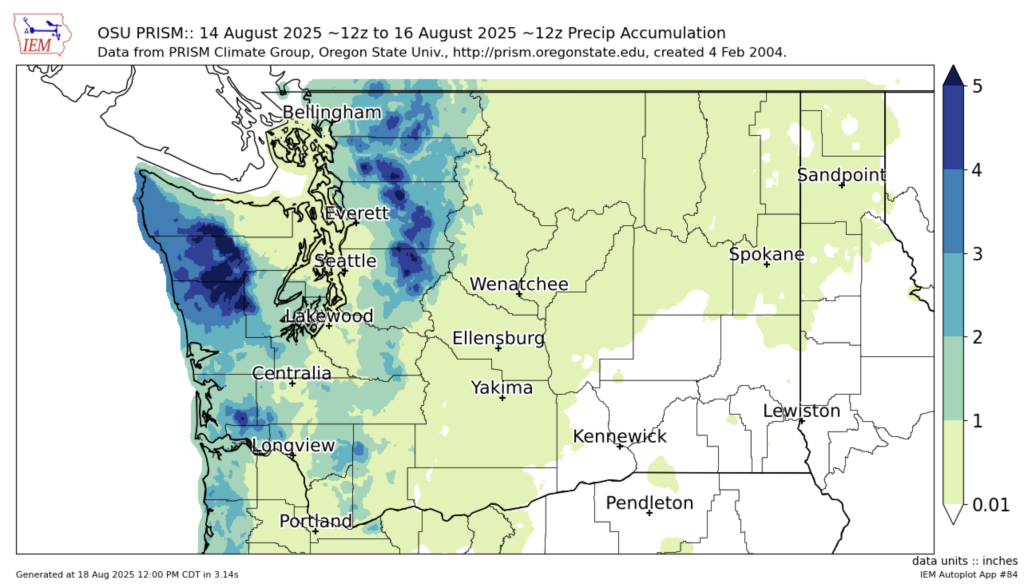 PRISM modeled precipitation accumulation from the August 14-16 rainfall event.
Although this rainfall was beneficial, especially given an exceedingly dry summer, a single rain event cannot end the persistent and longer-term dryness across the state. Total precipitation anomalies since the beginning of the water year, October 1, 2024 demonstrate just how much rainfall is “missing” compared to normal. Deficits of 5-10” in the western Washington lowlands and 20”+ across the Cascades and portions of the Olympics hit home the point that we will need multiple significant rainfall events over time to reverse our current drought situation. This map below of deficits since the beginning of the water year even includes the rainfall that fell August 14-16, and these large deficits still remain. Furthermore, these deficit values do not take into account deficits incurred during last year’s drought, underscoring the multi-year compounding nature of our current drought.
 Total precipitation deficit since the start of the 2025 Water Year, including contribution from the mid-August rain event.
Isolated to scattered thunderstorms continued through the second half of the month across the higher terrain of the eastern Cascades and northeastern Washington. A few lucky spots received heavy downspours, but these storms also brought lightning to areas with very dry forests and grasses.
Multiple fires have popped up across the eastern Cascades and northeastern Washington in late August, largely as a result of these lightning strikes, although a few of these fires are still under investigation. Lightning activity also sparked large fires in northern British Columbia this month. Visit the Northwest Interagency Coordination Center for the most recent updates and information fires across the state. Wildfire smoke is a serious concern for human health. Stay up to date on local outdoor air quality levels and learn more about how to protect yourself during smoke season.