By Karin Bumbaco
Water year 2025 is complete, and it’s time to take a look back and see how WA stacked up historically. The 2025 water year includes the 12 months from October 1, 2024 through September 30, 2025, as opposed to the usual calendar year. We use these months so we don’t split our wet season in two.
But first – a caveat. Our typical source of statewide temperature and precipitation data with historical rankings comes from the NOAA National Centers for Environmental Information (NCEI). Due to the ongoing government shutdown, the September 2025 and thus the entire water year numbers aren’t available. We’ve estimated them ourselves using a different gridded dataset, and will update this summary should the NOAA dataset differ from our estimates once the government reopens.
Overall, Washington was warmer and drier than normal for the water year as a whole. Averaged across Washington, the water year ranked as the 4th warmest since records began in 1895 and was 1.7°F above the 1991-2020 normal. While the water year had a few pockets of near-normal temperatures in Whatcom county, southwestern Washington, and the Olympic Peninsula, the large majority of the state had above normal temperatures. The difference from normal was larger across eastern Washington, with temperatures between 2° and 5°F above normal.
There was little variability in temperature anomalies from season to season, with Oct-Dec, Apr-Jun, and Jul-Sep all coming in with above average temperatures for the state as a whole. Summer (Jul-Sep) was farthest from normal, with a statewide anomaly of nearly 4.0°F above normal, ranking as the 2nd warmest Jul-Sep on record. The only cooler than normal season was Jan-Mar, where Washington average temperatures were 1.0°F below normal.
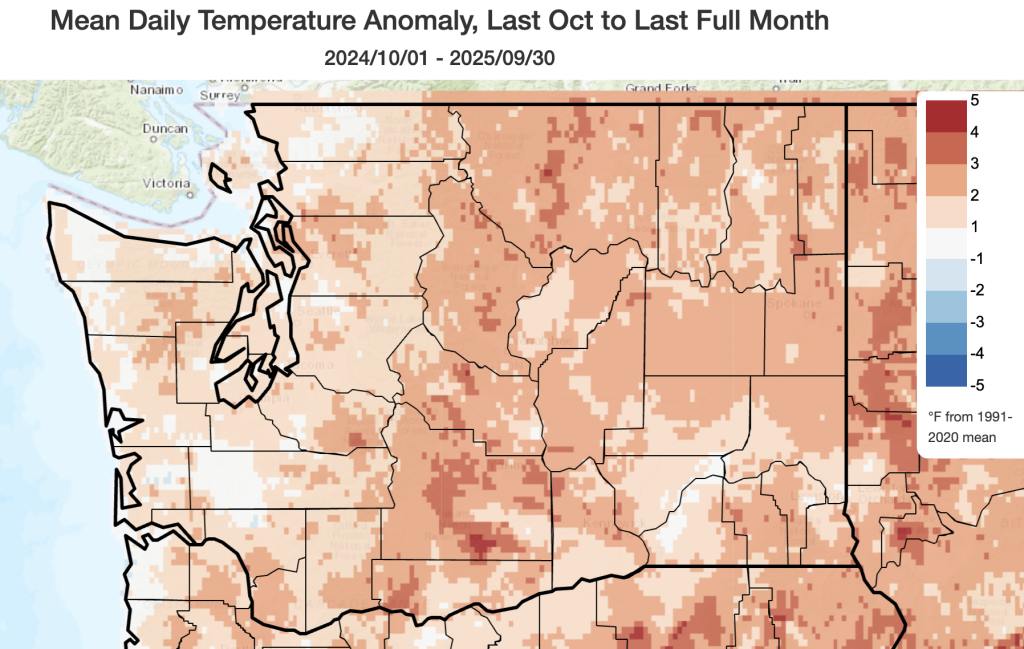 Average temperature departures from the 1991-2020 normal for water year 2025.
Total precipitation averaged across Washington was 89% of the 1991-2020 normal, not particularly extreme but on the dry end, ranking as the 37th driest since records began in 1895. Locally, the departures were greater than for the statewide average; most of western Washington, including the Cascade Mountains and their foothills received between 50 and 90% of normal precipitation for the water year. In contrast, water year precipitation was near-normal for much of eastern Washington, with even a few areas of above normal precipitation (110-130% of normal).
Since the bulk of Washington’s precipitation falls on the western portion of the state, all seasons had below normal precipitation when averaged statewide. Spring was particularly dry; Washington had its 6th driest Apr-Jun, receiving only half of its normal precipitation for those months. Precipitation was also low for other seasons: Oct-Dec (90% of normal), Jan-Mar (82% of normal), and Jul-Sep (68% of normal).
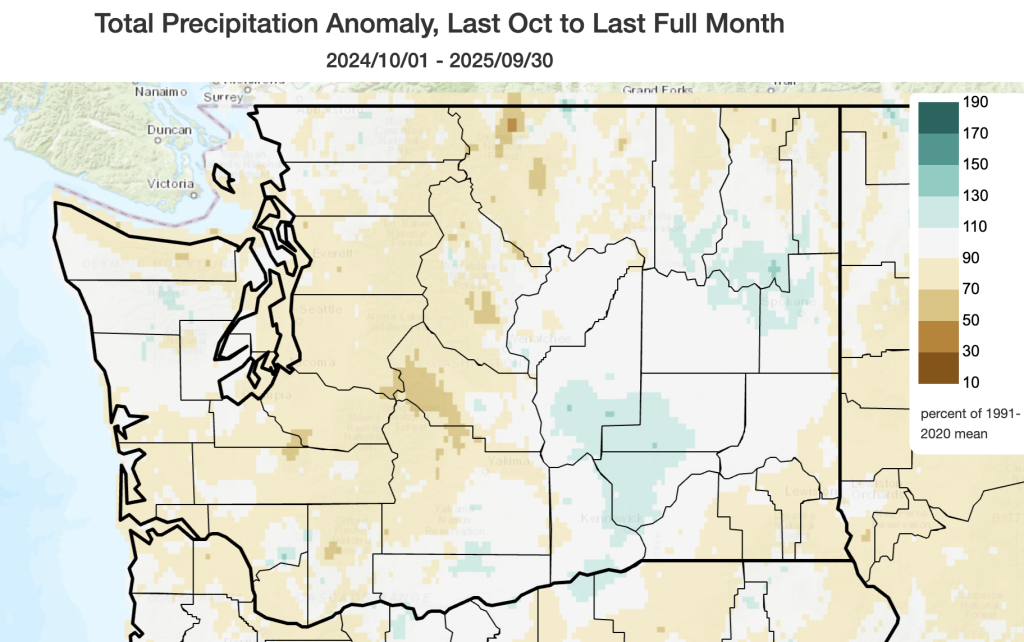 Precipitation percent of the 1991-2020 normal for water year 2025.
The drier than normal conditions across the Cascades were detrimental to snow building throughout the snow accumulation season. As shown by the flat lines on the snow accumulation plot below, early December, January, and early March were periods in which there was very little snow accumulation in our mountainous regions. January in particular set the state on an undesirable path since it is typically our second biggest snow accumulation month. While temperatures were below normal, precipitation was much below normal. Ultimately, the April 1st snow water equivalent for WA State was 87% of median with an earlier than normal peak snowpack (March 24) and meltoff occurring 2-4 weeks earlier than normal for some key watersheds.
The WA State Department of Ecology, with the Governor’s approval, extended the drought emergency for Yakima Basin watersheds on April 8, 2025. On June 8, 2025, the drought emergency was expanded to include watersheds in Snohomish, King, Pierce, Lewis, Thurston, Okanogan, Chelan, Clallam, Jefferson, and Ferry counties.
Why the early drought declarations with only moderately below normal snowpack? Snowpack and precipitation conditions for the previous two water years had a part in 2025 water supply. The Washington snow water equivalent plot below includes traces for the 2023 and 2024 water years. Statewide snowpack in 2024 was much below median – only 70% of median on April 1, 2024 – and while 2023 was near-median due to late season snow accumulation (101% of median on April 1, 2023) a quicker than usual melt out nonetheless caused water supply challenges that summer.
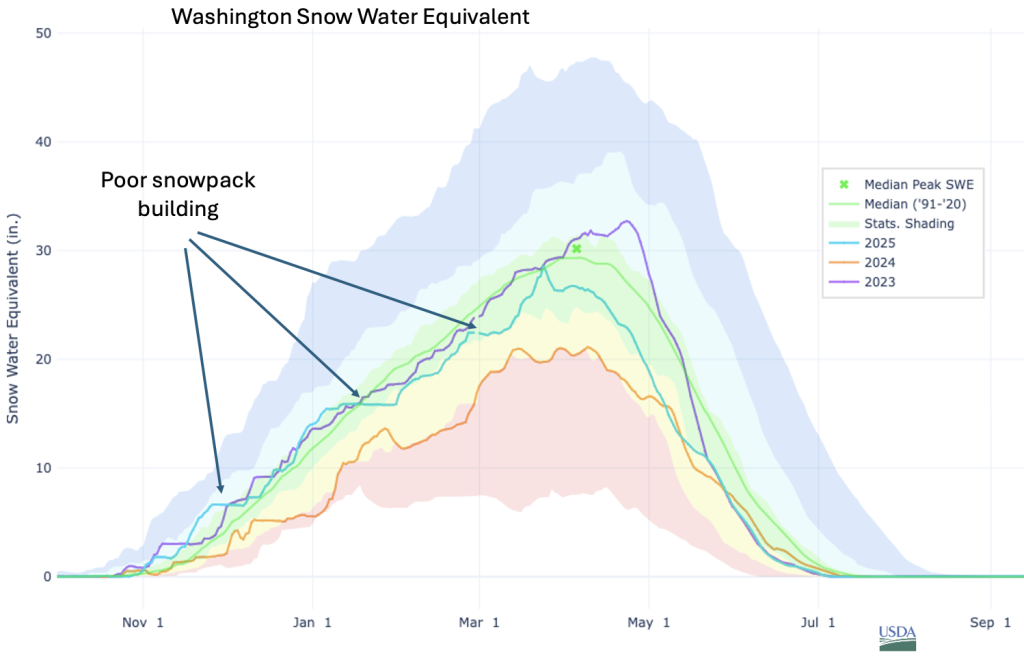 Time series of snow accumulation averaged over Washington State for the 2023 (purple), 2024 (orange), and 2025 (blue) water years
Averaging statewide, there was also below normal precipitation for each of the last three water years (2023: -6.75”; 2024: -4.57”; 2025: -4.97”), resulting in a total of about 16” of missing precipitation. And this is just the average for Washington. Individual basins have smaller or larger deficits. The Upper Yakima Basin, for example, received less than two and a half water years worth of precipitation over the span of three water years, amounting to about a 42” deficit in precipitation in that critical area.
These conditions resulted in much below normal streamflows from May through September this year, aside from a temporary blip in flows thanks to some mid-August precipitation. The earlier than normal pulse of streamflow in March and April in the runoff plot is due to earlier than normal snowmelt while the typical snowmelt peak in May and June was nearly nonexistent for 2025.
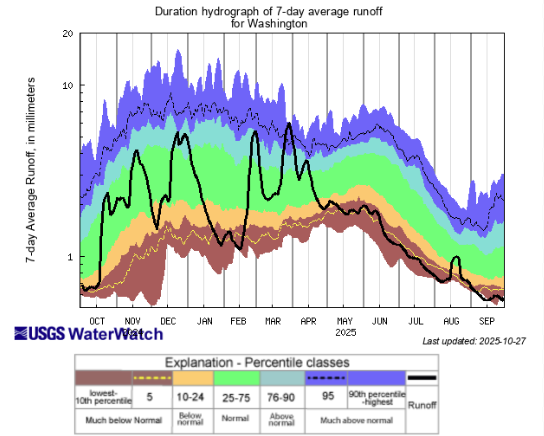 7-day average runoff over Washington for the 2025 water year.
Finally, to end on a positive note: the summer fire season was not as bad as initially feared and could have been worse than it was. While there was a greater number of fires than usual and above average acreage burned, the area burned wasn’t as large as some bad fire seasons of recent memory. In consultation with colleagues at the Department of Natural Resources, this was likely due to three important factors: 1) the lightning ignitions in late July were from thunderstorms that also were accompanied by heavy rainfall to help lessen fire spread, 2) there were fewer instances of strong winds from June-September compared to the last 10 years to fan flames, and 3) there appear to have been benefits attributable to early fire detection and successful initial firefighter efforts from several years of investment.