By Jacob Genuise
Key Messages:
- November temperatures were above normal statewide (7th warmest since 1895) with the largest departures from normal across the Columbia Basin and northeastern Washington.
- Precipitation was below normal across the Pacific Coast, central and southern Cascades, and southeastern Washington. Above normal precipitation occurred in central and northeastern Washington.
- Fall (September-November) 2025 featured above normal temperatures with record warm temperatures in eastern Washington. Precipitation totals were more mixed, with most locations near-normal.
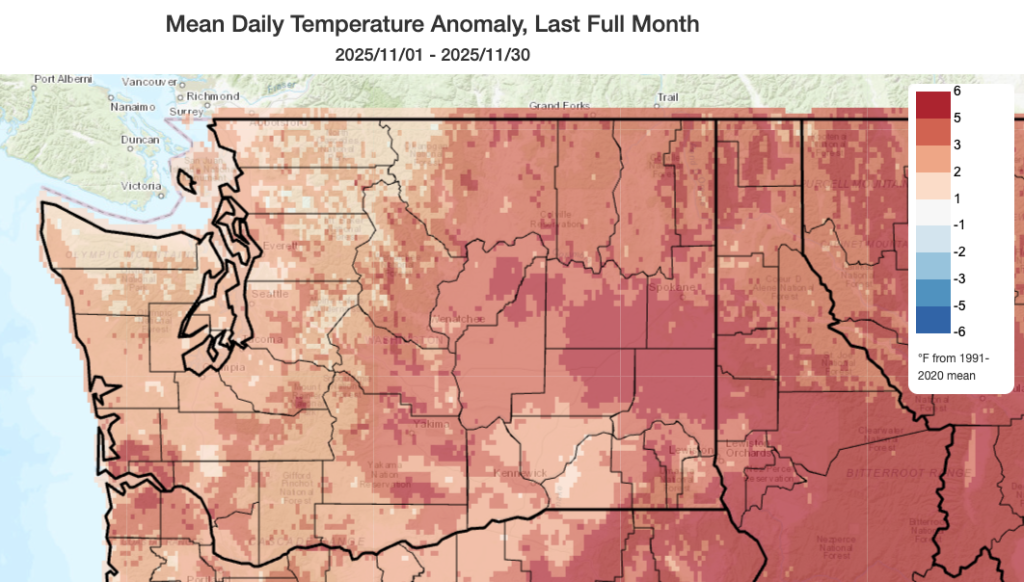 November 2025 mean temperatures compared to 1991-2020 normals.
November temperatures were above normal statewide ranking as the 7th warmest November since 1895. Temperatures were 3-7°F above normal across much of eastern Washington, the eastern slopes of the Cascades, and the far southern Pacific coast. This included Spokane (+4.7°F), Omak (+5.0°F), Pullman (+4.8°F), and Hanford (+4.9°F).
Temperatures were 1-3°F above normal across much of the Olympic Peninsula, Puget Sound, the Tri-Cities, and Columbia Gorge. There were small pockets of near-normal temperatures in the northwestern Cascades and the far northern portions of the Olympic Peninsula.
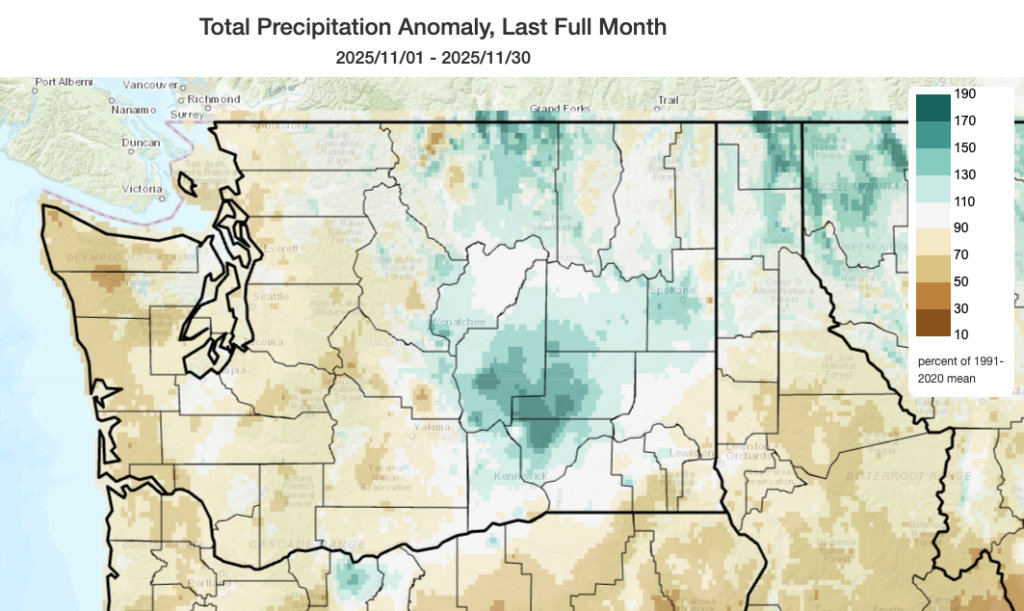 November 2025 precipitation as a percent of 1991-2020 normals.
Precipitation totals were mixed across the state with areas of both above normal and below normal precipitation. Precipitation was above normal in the central Columbia Basin north of the Tri Cities, in the Okanogan Valley, and areas just to the west of Spokane. Statewide, precipitation was 96% of normal.
Precipitation was below normal in the far southeast corner of the state near the Blue Mountains and across the majority of western Washington. Precipitation fared worse along the Pacific Coast where precipitation totals were between 50 and 70% of normal. Precipitation was also slightly below normal in the central and southern Cascades, which contributed to poor snowpack accumulation throughout the month. Read the snowpack and drought summary for an update on snowpack conditions.
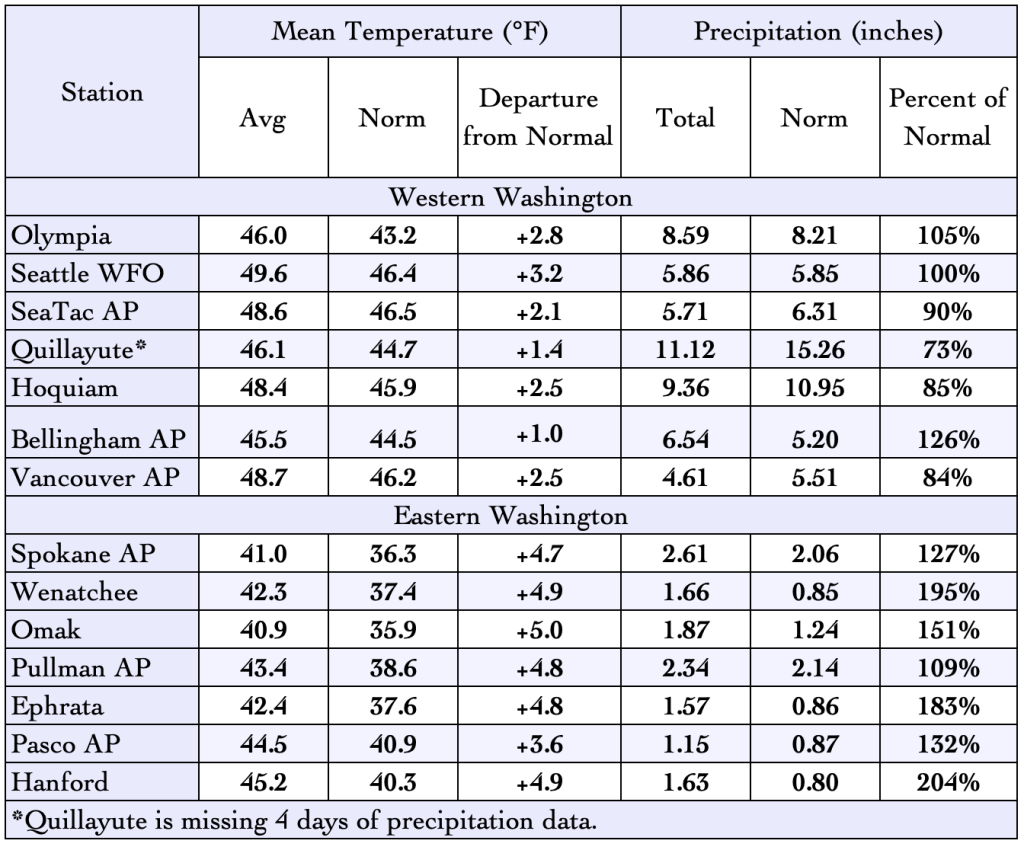 November 2025 climate summaries for select locations around Washington. Anomalies are relative to a climate normal baseline of 1991-2020.
Fall in Review
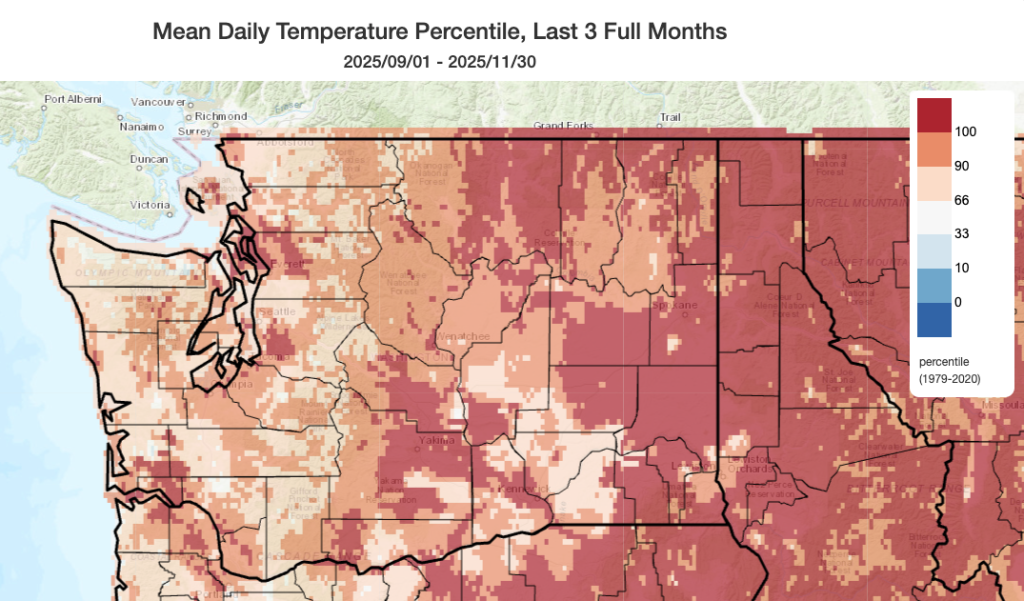 Fall (September, October, November) 2025 mean temperatures percentiles compared to the 1979-2020 period.
Looking back at the last three full months (September-November), a similar theme emerges of above normal temperatures and mixed precipitation departures. Beginning with temperatures, the above map shows mean temperature percentiles for the fall period. The dark red shading indicates record warm conditions across large portions of eastern Washington and smaller pockets in western Washington. All areas of the state have experienced warmer than normal temperatures this fall.
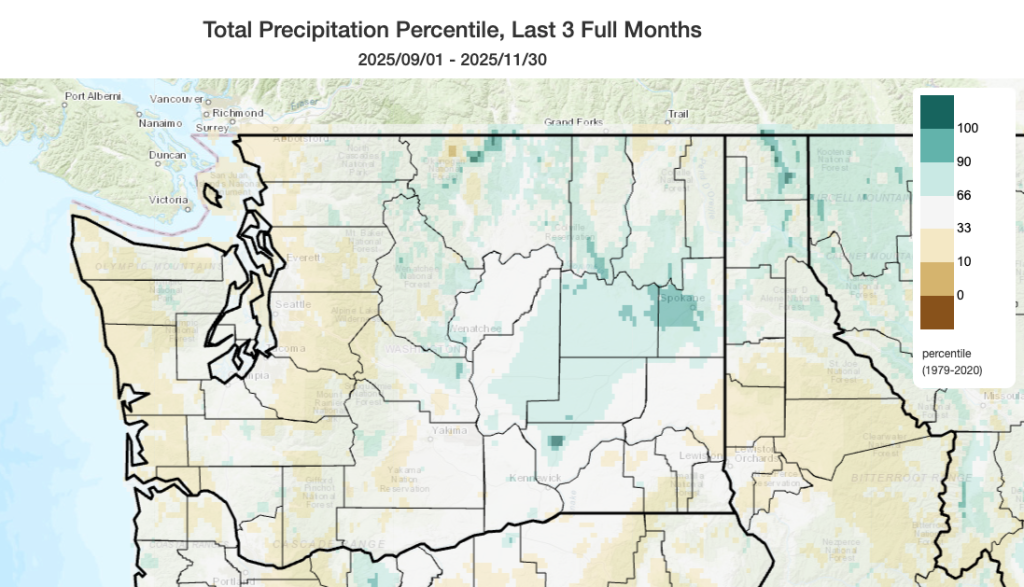 Fall (September, October, November) 2025 precipitation percentiles compared to the 1979-2020 period.
Precipitation in most areas was near normal over the fall period. The map above shows precipitation percentiles for this period, and light brown shading depicts areas where precipitation was in the driest third of years on record (since 1979) such as the Pacific coast and portions of the western Cascades foothills. Light blue shading depicts precipitation within the wettest third of years including the northern portion of the Columbia Basin and portions of Okanogan and Chelan counties.