By Jacob Genuise
Key Messages:
- Precipitation for the current water year is well-above normal, but not enough to overcome multi-year deficits.
- Snowpack remains below normal in the central and southern Cascades, Olympics, Blue Mountains, and the northeastern WA Rockies.
- Snowpack is near normal in the northern Cascades, boosted by well above normal snowpack in the upper elevations above 6,000 feet.
- The December storms brought well above normal streamflow to the state and boosted reservoirs, many of which are above normal levels for this time of year.
- The rest of the season’s snowfall will be crucial in determining whether our snow drought will improve.
 Map of monthly streamflow relative to average streamflow for December 2025.
Wet conditions with numerous periods of flooding led to much above normal streamflow across most of the state. Areas in the northern and central Cascades and part of the Olympic Peninsula experienced record high streamflow for the month. Streamflow was near or slightly above normal in the Columbia Plateau where less precipitation fell throughout the month. High streamflows were primarily the result of a strong atmospheric river event from December 8-11 which brought very high snow levels and widespread mountain rains.
December began with near record-low statewide snow water equivalent (SWE). Warm conditions associated with the December 8-11 atmospheric river caused statewide snowpack to decline to the lowest level on record by December 14-16. The highest elevations (i.e. coldest) of the Cascades still saw notable gains in snowpack during these events, but most stations across the state recorded declines in snowpack as it was too warm for snowfall.
 Statewide Snow Water Equivalent from October 1, 2025 through January 7, 2026. The solid green line represents the median SWE value from 1991-2020, and the black line represents SWE for the current water year. Red shading shows values below the 10th percentile (interpreted as being drier than 90% of all years), and yellow shading represents the 30-10th percentiles.
On the bright side, the wet conditions improved reservoir storage across western Washington and in the Yakima Basin. This graph of total storage in Yakima Basin reservoirs shows an increase of over 400,000 acre-feet in the days during and following this event which pushed reservoir storage above average for this time of year. However, given very little of this precipitation fell as snow, the snowpack remains below normal in the Yakima Basin. Improvement in snowpack is still needed over the rest of the season to ensure these reservoirs are able to reach full capacity during spring snowmelt.
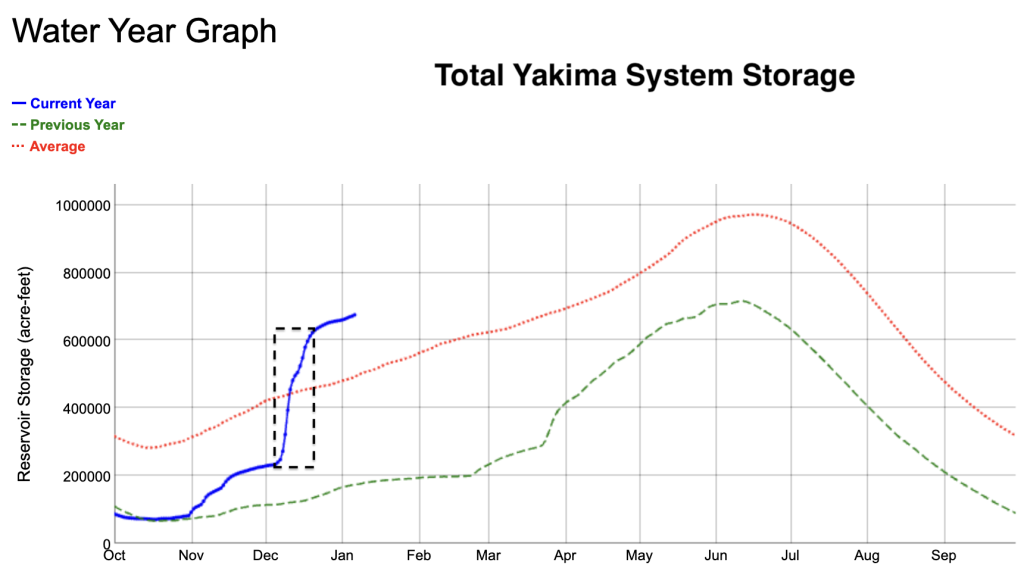 Yakima Basin Total Storage, in acre-feet during WY 2026. Reservoir increases due to the December 8-11 flooding event are within the black dashed box.
Following the Dec 8-11 event, a series of colder storms finally brought beneficial growth in the mountain snowpack with slight improvements in SWE values through the rest of the month as seen on the above graph of SWE. However, as of January 1, snowpack remained below median in the majority of basins including 43-80% of median in the central and southern Cascades, Olympics, and Blue Mountains. Snowpack is near the median in the northern Cascades, but this is largely due to near-record snowfall at a limited number of high-elevation stations, which might not be representative of the total amount of snow storage in these basins. Even in these areas, lower elevation stations report below median snowpack.
 Snowpack, in terms of snow water equivalent, as of January 1, 2026. Basin percentages represent basin-wide station averages, while dots represent individual SNOTEL stations.
In early January, additional mountain snow has led to incremental improvement in snowpack in the central and southern Cascades, but these basins remain below normal. As of January 14th, statewide average snowpack is below normal at only 66% of median. In the short term, a pattern change is expected for the Pacific Northwest in the middle and latter half of January. There is a good chance of drier than normal conditions continue for at least the next few days.
According to the U.S. Drought Monitor, western Washington has seen considerable improvement in drought conditions due to ample rainfall in December. Areas near Puget Sound and the Cascades have experienced 2 or 3 class improvements since December 2, and areas of far northeastern and southeastern Washington have also experienced improvements in drought conditions. These improvements largely are largely due to short-term rainfall; substantial multi-year precipitation deficits continue in the Cascades. The rest of the winter’s snowpack will be crucial for determining water supply conditions heading into summer 2026.
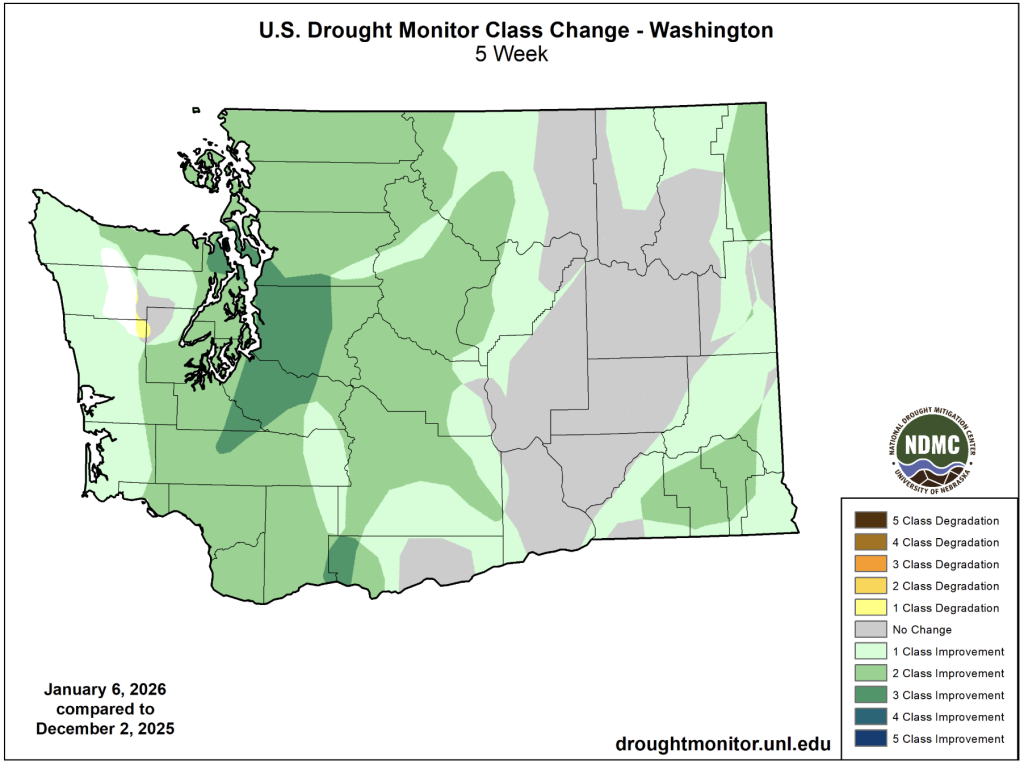 Change in U.S. Drought Monitor class from December 2, 2025 to January 6, 2026.
As of January 6, D1 moderate drought conditions remain across parts of the lower Columbia Basin, southeast Washington near the Blue Mountains and in the Okanogan Highlands.
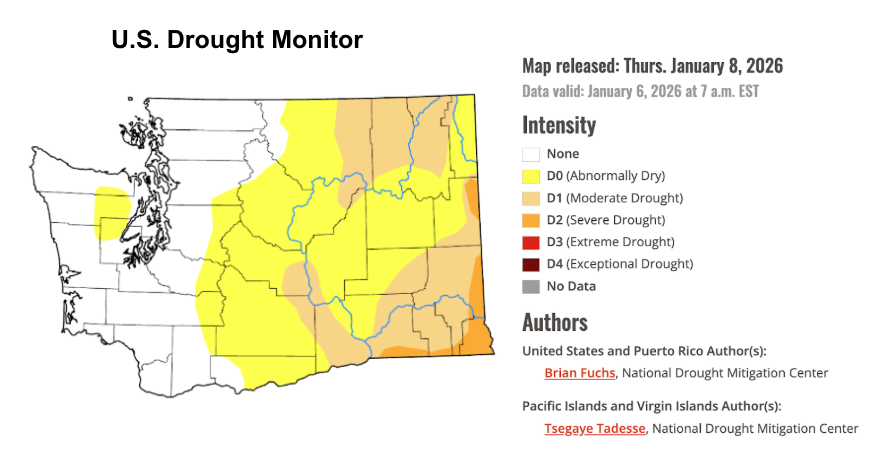 U.S. Drought Monitor for Washington. Data valid on January 6, 2025.
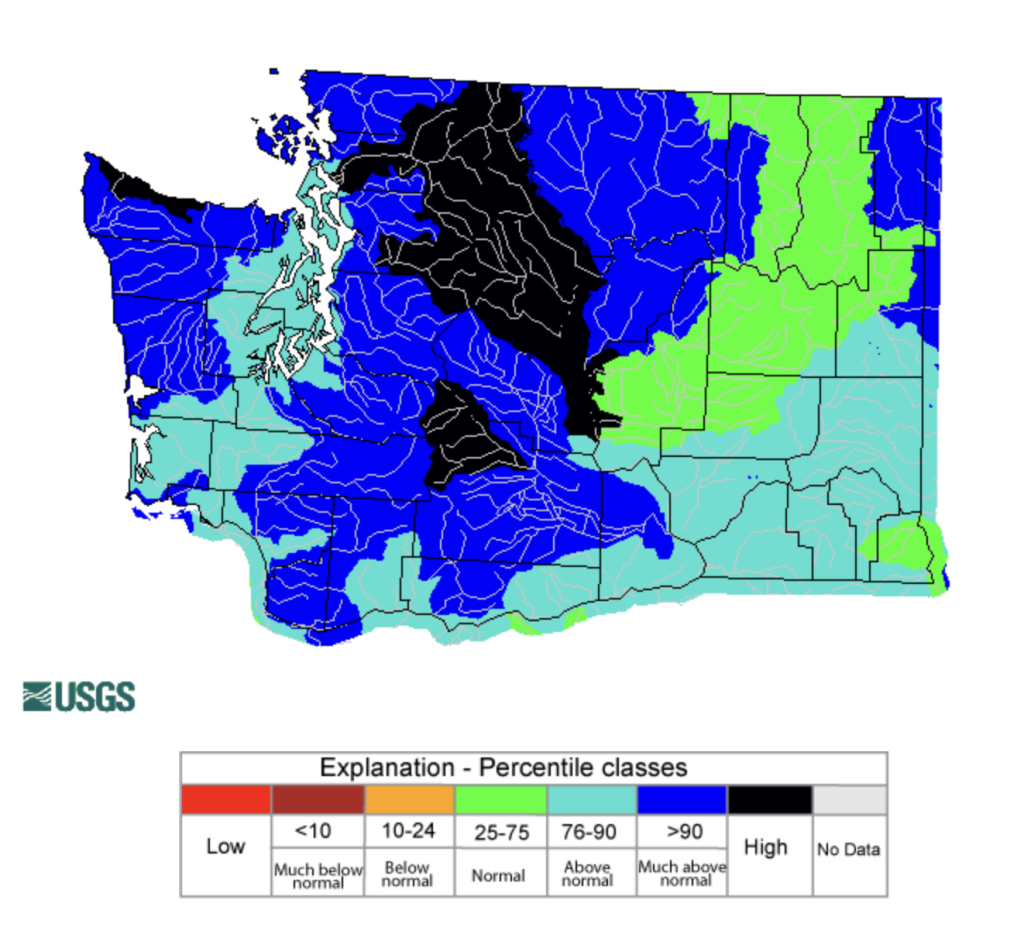
D2 severe drought exists on the extreme eastern and southeastern borders of Washington. Abnormally dry conditions continue for the central and southern Cascades and the Olympics to represent the much below normal snowpack. It’s still fairly early in the snow season and many things can change, but the bottom line is that just because we are wet right now doesn’t mean spring and summer water supply concerns are completely eliminated. Long-term precipitation deficits remain following the last three years of drought in the Cascades despite recent flooding. This is illustrated in the 36-month precipitation percent of normal map below. Large deficits also are present over the past 24-months.
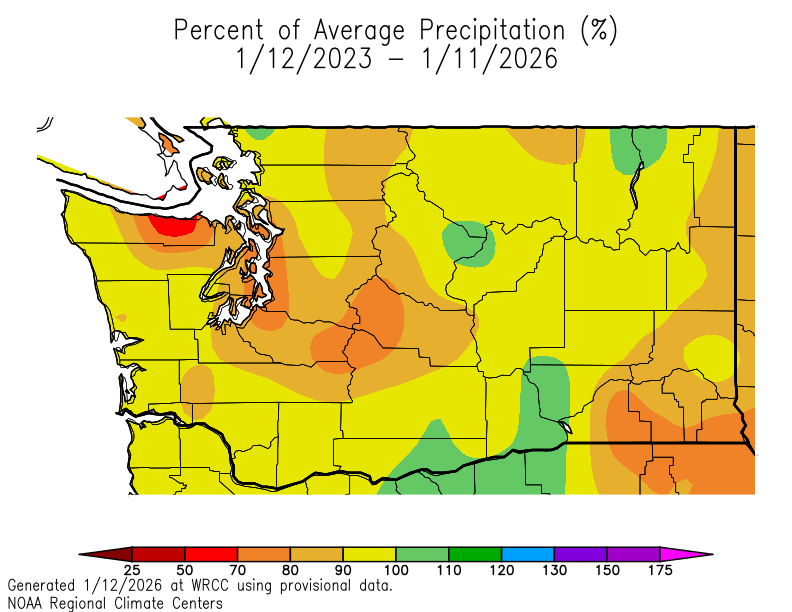 Multi-year (January 2023-January 2026) percent of average precipitation in Washington. This includes the recent flooding event.