By Jacob Genuise
Key Messages:
- January was the 12th warmest January on record since at least 1895. Temperatures were around 2-5°F above normal for nearly all areas of the state.
- Precipitation was below normal across most of the state and ranked as the 22nd driest January on record since at least 1895 statewide.
- Statewide, precipitation was only 64% of normal with less than 50% of normal precipitation on the east slopes of the Cascades and in the lower Columbia Basin.
- Similar to January 2025, January 2026 featured a near record-long dry streak of 14+ days with no precipitation.
Temperature: Temperatures in January 2026 were warmer than normal almost everywhere in the state. The higher elevations of the Olympics and the Cascades were among the warmest relative to normal (+4-6°F) due in part to persistent temperature inversions that kept temperatures warmer aloft. Temperatures were +2-4°F above normal across much of the Columbia Basin including +4.5°F at Omak and +3.0°F in Ephrata. Spokane also experienced temperatures +2.4°F above normal. Temperature inversions led to cool overnight temperatures in low-lying areas and allowed for localized areas of near-normal temperatures in western Washington (+0.9°F in Olympia and -0.6°F at Vancouver Airport) and along the lower Columbia Gorge.
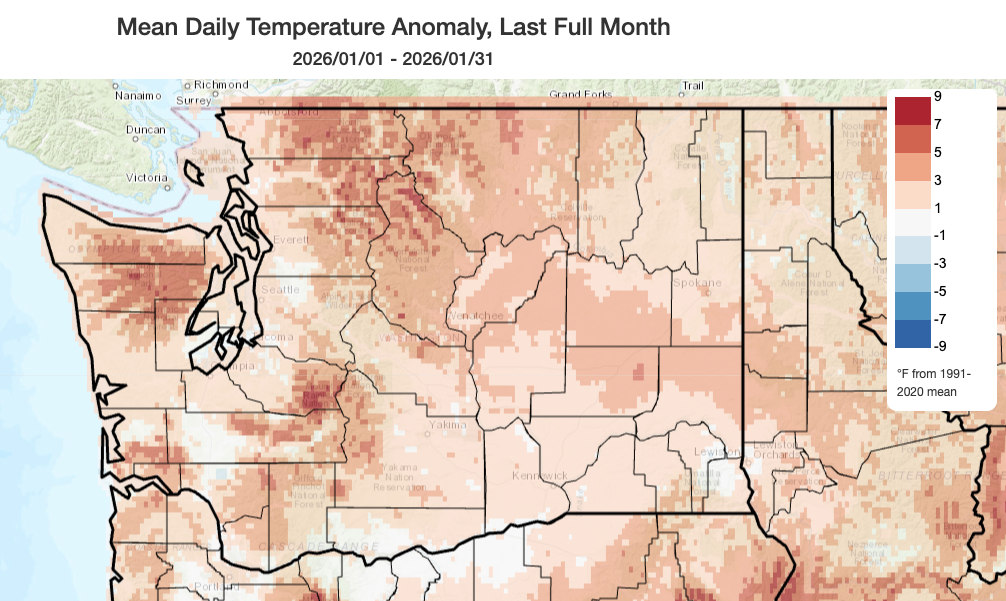 January 2026 mean temperatures compared to 1991-2020 normals.
Precipitation: Precipitation was below normal for the vast majority of the state. The eastern slopes of the Cascades and the lower Columbia Basin experienced the driest conditions relative to normal including only 34% of normal precipitation in Wenatchee, 46% of normal in Omak, and 30% of normal in Pasco/Tri-Cities. Spokane and Pullman fared a bit better, but still came in below normal with 61% and 68% of normal precipitation respectively.
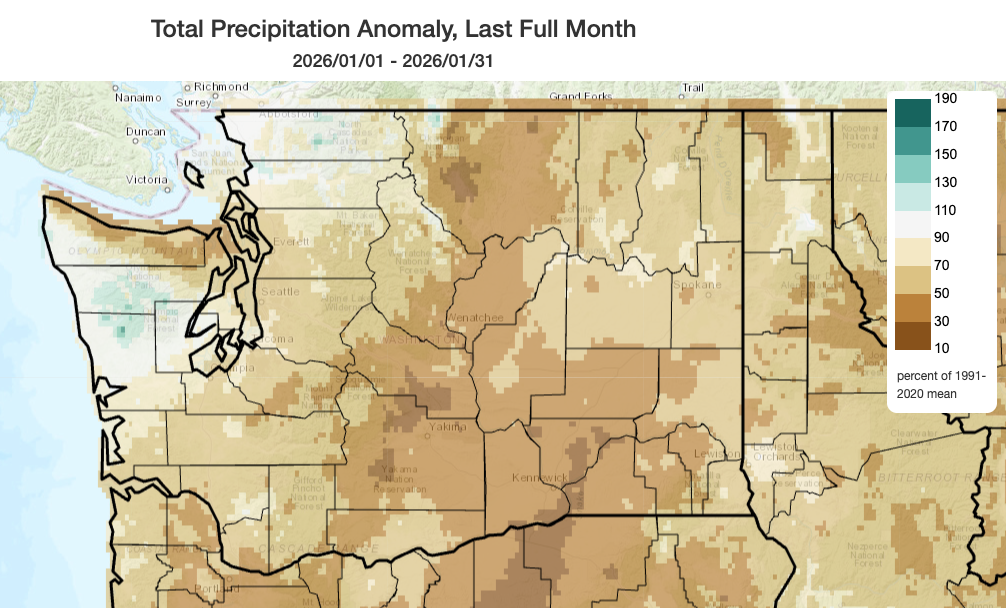 January 2026 precipitation as a percent of 1991-2020 normals.
These drier than normal conditions can be attributed to a persistent and strong ridge of high pressure that steered storm tracks away from our region. As a result, very little precipitation fell across the state from January 14-27 and many stations recorded over two weeks of no rainfall at all. The longest dry streaks this past month are noted on the leftmost column of the table below. Dry streaks here are defined as consecutive days with no precipitation at all, not even trace amounts. Please see the note on Hoquiam’s 2026 streak for additional context on that station’s streak.
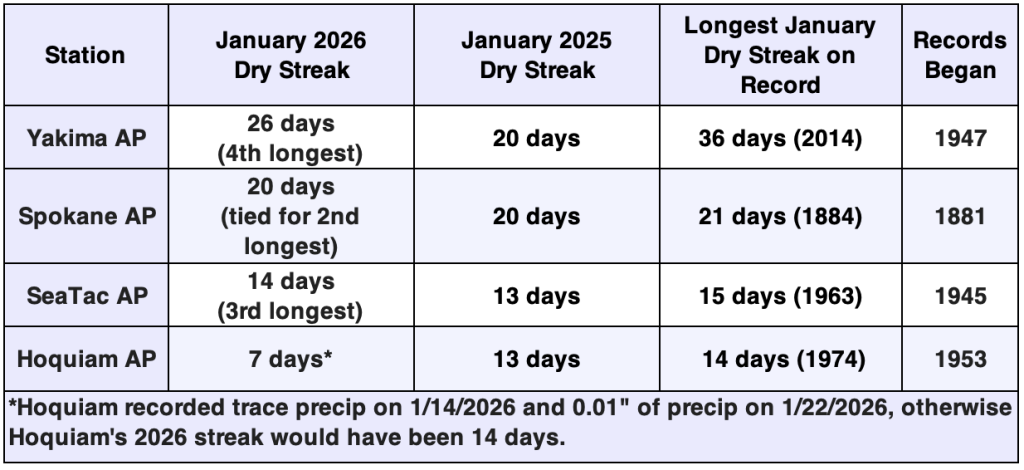 Dry streak lengths in January 2025 and January 2026 compared to longest January streaks on record at select stations.
Some may feel a sense of déjà vu as they recall our eerily similar dry streak in January 2025, also included in the table below. While these mid-winter dry streaks are atypical, they were not quite record breaking in either year. For example, the record dry streak for Yakima Airport lasted 36 days, starting in December of 2013 and ending in January 2014.
Exceptions to these drier than normal conditions this past month included near normal precipitation along the Pacific coast, including 84% of normal in Hoquiam. Portions of Whatcom and Skagit counties also saw near normal precipitation including 96% of normal in Bellingham. Small areas of slightly above normal precipitation occurred in the upper elevations of the Olympics.
Climate Toolbox
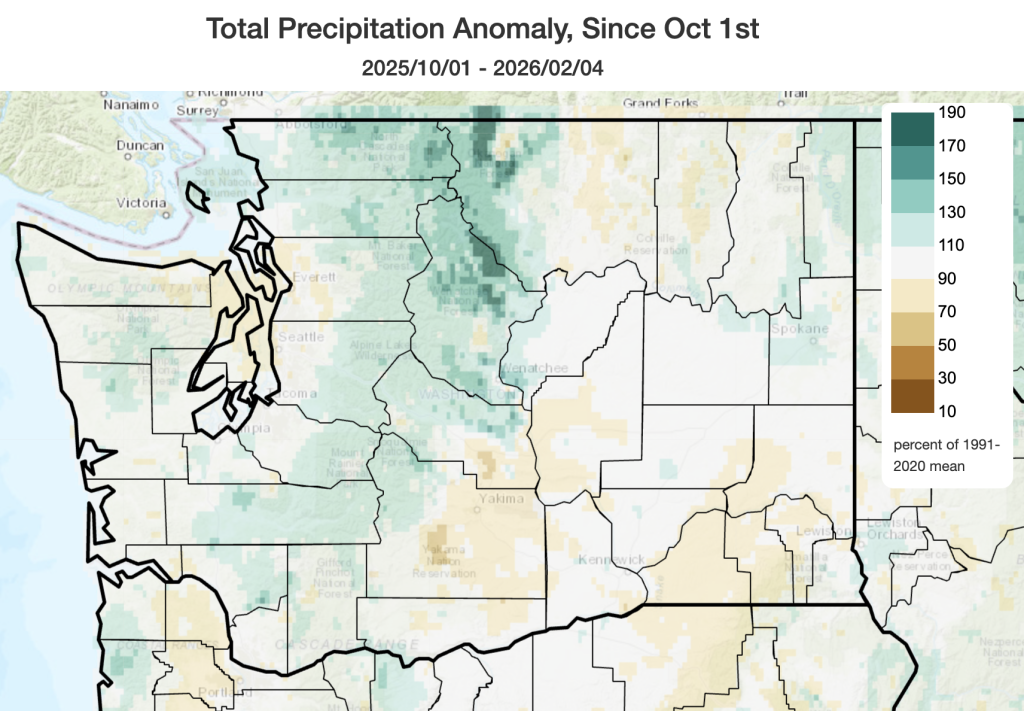
Precipitation percent of 1991-2020 median since the beginning of the current water year, October 1, 2025.
For the water year as a whole which began on October 1, 2025, precipitation has been above normal in the Cascades, especially the northern and northeastern slopes. Water year precipitation has fallen behind normal near Yakima on the southeast slopes of the Cascades, and near Walla Walla and the Blue Mountains.
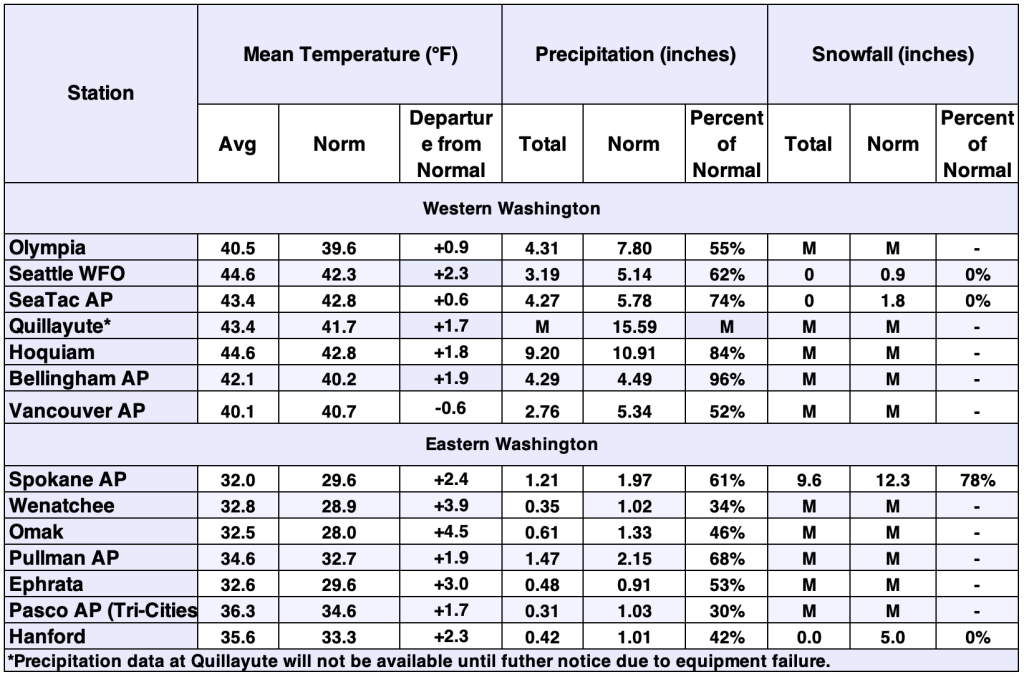 January 2026 climate summaries for select locations around Washington. Anomalies are relative to a climate normal baseline of 1991-2020.