By Jacob Genuise
Key Messages:
- As of February 2, statewide snowpack is well below normal near 55% of median.
- Water year precipitation remains above normal in most of the Cascades, but warm storms throughout the season and January’s dry spell both contributed to the current snowpack deficits.
- To end the season with a normal snowpack, we would need to have near-record amounts of snow for the rest of the winter season.
- Areas of abnormally dry conditions on the U.S. Drought Monitor expanded slightly in the Cascades to account for this worsening snow drought.
The month began with much-needed heavy mountain snow which improved statewide snowpack temporarily. This multi-day snow event peaked from January 5-8 and brought 2-3 feet of snow for mountain passes and benefitted all basins in the state. During winter, we need storms to occur regularly to keep up with our seasonal snowpack averages, not just one or two large events. An additional warm atmospheric river event brought largely rainfall across the Cascades and Olympics from January 11-14.
By January 14, a very persistent dry spell began and lasted through the majority of the month. This graph of statewide average snow water equivalent below shows a clear flatlining in snowpack through much of the month as a result of this dry spell. The solid black line depicts the observed snowpack this year while background shading depicts historical percentiles with green shading representing near-normal snowpack. Our snowpack as of February 2 is in the 5th percentile. Put another way: as of now, our snowpack is lower than 95% of all years in the historical record.
 Statewide Snow Water Equivalent from October 1, 2025 through February 2, 2026. The solid green line represents the median SWE value from 1991-2020, and the black line represents SWE for the current water year. Red shading shows values below the 10th percentile (interpreted as being drier than 90% of all years), and yellow shading represents the 30-10th percentiles. Dotted lines represent projected snowpack scenarios based on historical percentiles, not official forecast conditions.
During the month of January, warmer than normal temperatures during this period led to some gradual mid-winter snow melt, especially in the lower elevations, but dry weather was the main cause of our worsening snowpack situation this month. However, for the season as a whole since October 1, 2025, precipitation is still running above normal in most of the Cascades, and warm rain-dominant storms have been a larger contributor to low snowpack.
The colored dashed lines on the above graph that extend from the end of the solid black line depict the range of outcomes we can expect for the rest of the year. These are calculated based on how statewide snowpack has changed from February 2 onward in previous years. Each color corresponds to a given percentile, with higher percentiles indicating snowier years and lower percentiles indicating drier years. For example, the green dashed line labeled 50% is the median line – showing how our snowpack would evolve if we received around average snowfall for the rest of the season. The bottom red dashed line and the top dark blue dashed line indicate how the snowpack would evolve if we received record low or record high snowfall, respectively. Note: These are not forecasts. Instead, they are showing the range of possibilities based on what we’ve experienced in the past. These projections show that we would need a remarkably snowy, near-record end to the snow season to reach our normal peak in snowpack by the end of the season.
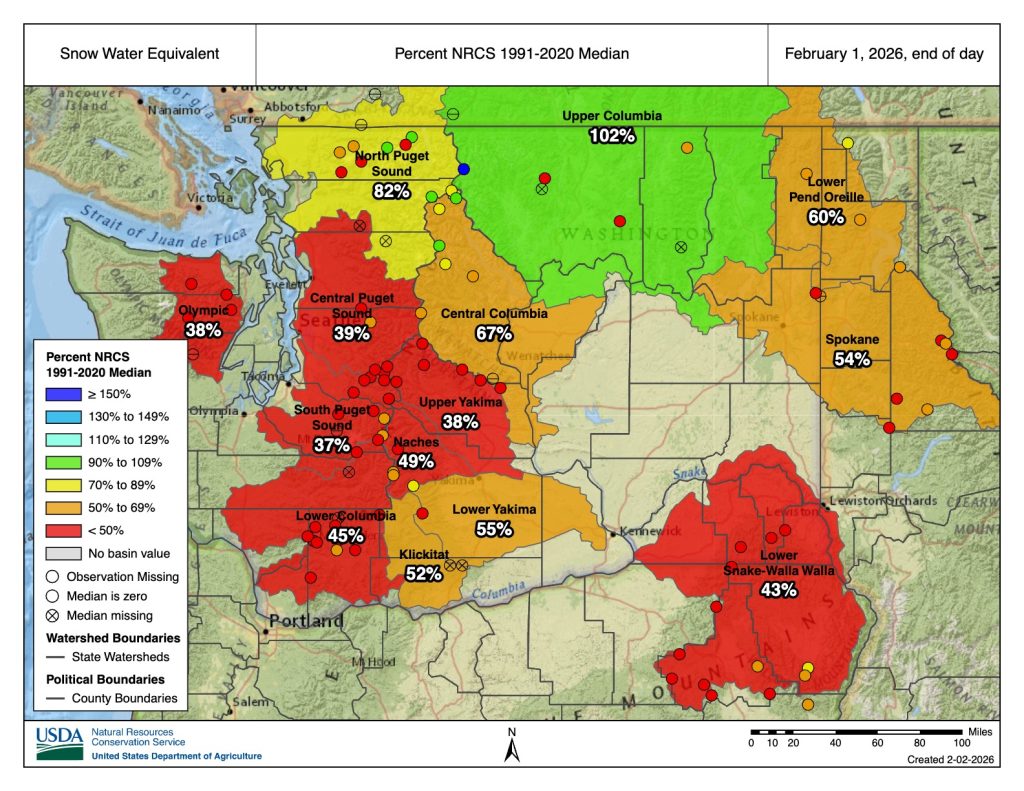 Snowpack, in terms of snow water equivalent, as of February 1, 2026. Basin percentages represent basin-wide station averages as a percent of 1991-2020 median, while dots represent individual SNOTEL stations.
As of February 1, statewide average snowpack was only 55% of the median for 1991-2020. Only the Upper Columbia is near-normal (102% of median) and the North Puget Sound Basin (82% of median) is the basin in the next best shape, but still below median. All other basins are well below normal as of February 1. These basin averages are also still skewed by only one or two high elevation stations that have picked up above normal snowpack while middle and lower elevation stations are generally below 70% of normal.
The snowpack story is at its worst in the Olympics, central and southern Cascades, and in eastern Washington basins. The Olympic, Central and Southern Puget Sound, Upper and Lower Yakima, Naches, and Walla Walla basins are all now below 50% of normal snowpack, and many basins have fallen below 40% of normal due to the persistent dry weather this month.
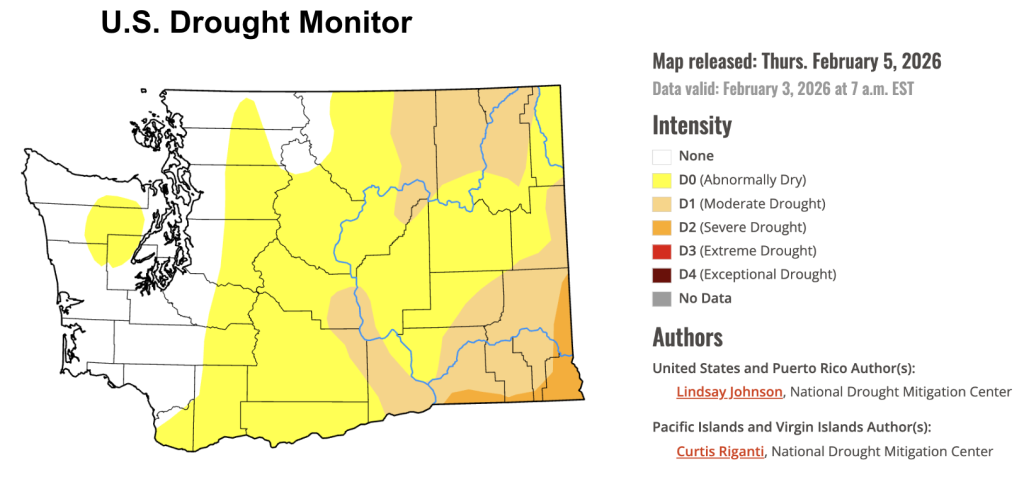 U.S. Drought Monitor for Washington. Data valid on February 3, 2026.
According to the U.S. Drought Monitor, abnormally dry conditions remain over large portions of the state including the central and southern Cascades, the lee of the Olympics, and the central Columbia Plateau. Abnormally dry conditions also expanded westward slightly into the western slopes of the Cascades due to snow drought. Moderate drought conditions remain in eastern portions of Okanogan County, Ferry County, and Stevens County as well as along the Columbia Rriver from Yakima to the Oregon border and in southeastern Washington. Severe drought conditions remain across the far southeastern corner of the state.
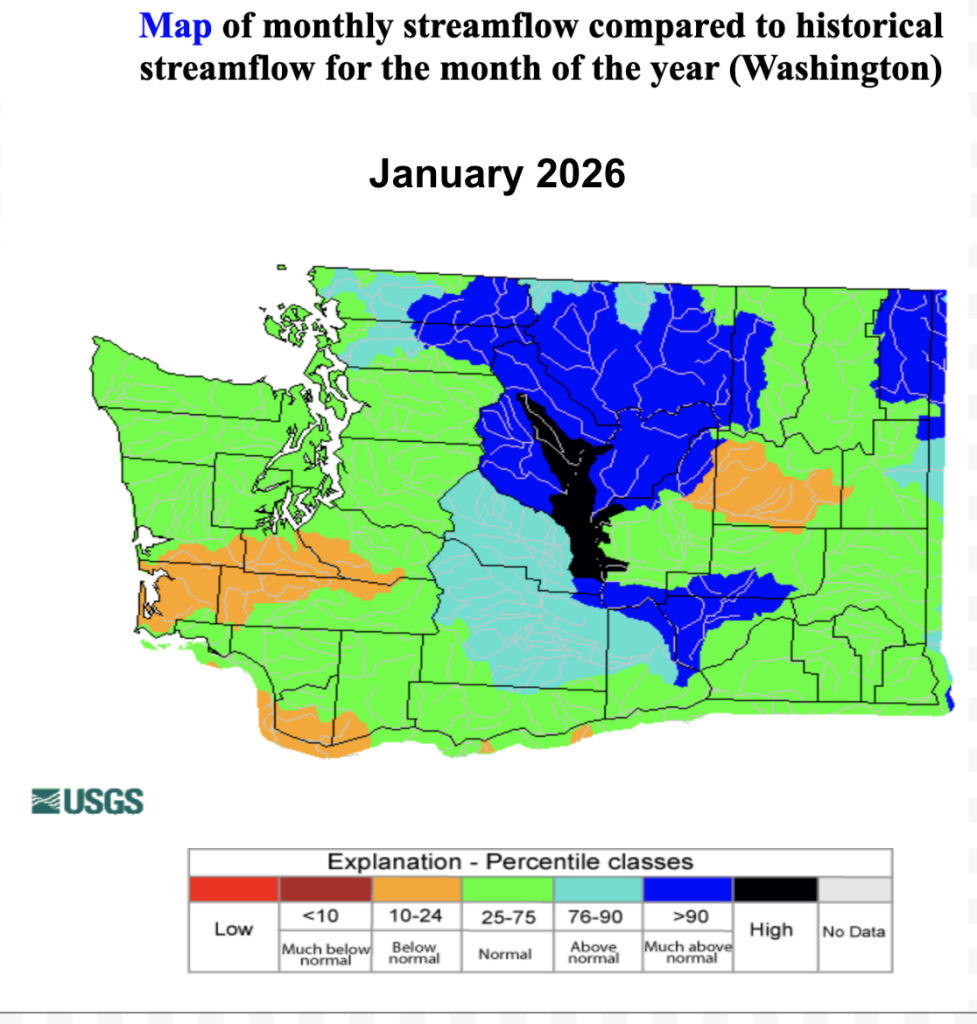 January 2026 streamflow relative to historical streamflow by basin.
January streamflow shows above normal and much above normal streamflow for basins in the eastern Cascades. This is due to a combination of above normal precipitation in the Cascades for the water year thus far, gradual snowmelt during warmer spells throughout January, and a warm atmospheric river event that brought rainfall for all but the highest elevations in the mountains from January 11-14. This shift to less snow and more rain leads to higher flows in the winter and lower runoff in Spring.
Rivers on the east side of the Cascades also typically have low baseline streamflow in the winter, so even small melting events and warm precipitation and runoff events can skew these percentiles easily. Thankfully this snowpack melt can be collected in some reservoirs, but it will limit the melt out that we would have gotten in the spring if this mid-winter melt had not occurred.
For rivers not primarily fed by snowmelt, such as the Chehalis, monthly streamflow in January was below normal due to the lack of rainfall during the month.