By Guillaume Mauger
This month we’d like to take a break from the news about the snow drought and look back at flooding that happened in December. Many agencies, utilities, and other managers are taking stock of the flooding now that it’s behind us. The most important work to do here is understand the response – what worked, what didn’t, and what we can learn going forward. I published an op-ed in the Seattle Times a few years back on how important this is for building climate resilience.
One small but important part of these retrospectives is understanding how big the event was. I mean this as separate from the climate change “attribution” question – how much of a role climate change played. That’s an important question too, of course, but here we want to simply understand how big the December floods were relative to what we’ve seen in the past.
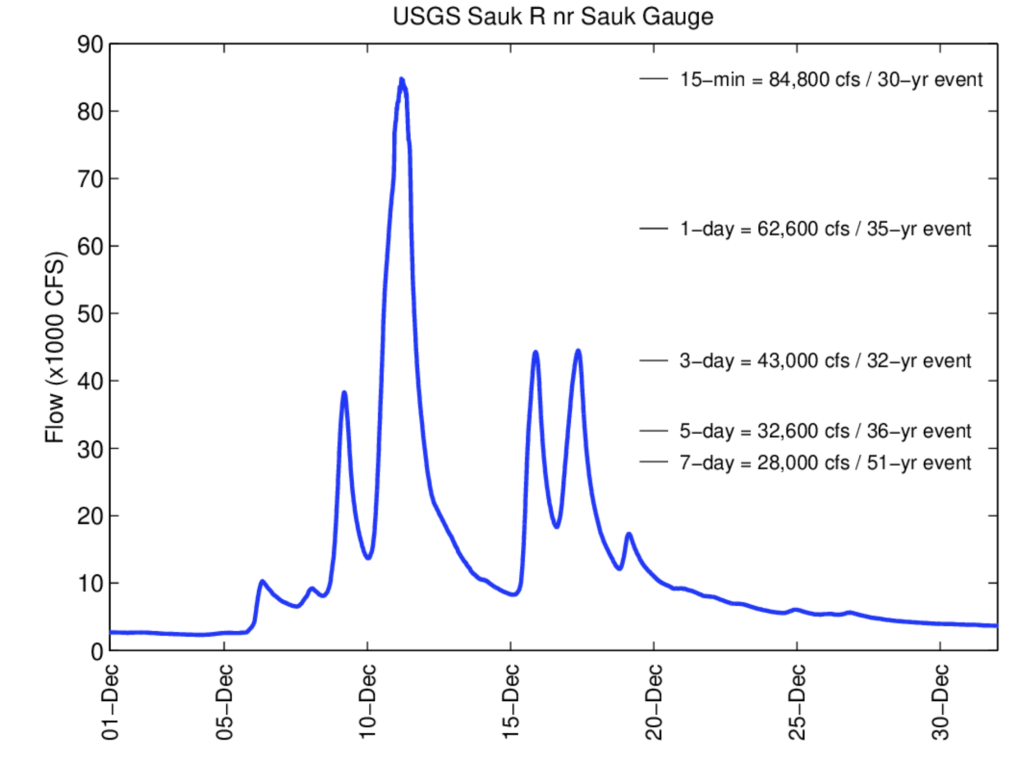 Plot of 15-minute flows for the USGS Sauk River near Sauk gauge (ID: 12189500) for the month of December. The text on the plot lists the peak flow for averaging times, or durations, along with the estimated flood frequency for each. Records for the Sauk R near Sauk gauge date back to 1911.
As a starting point, here’s a plot showing the December streamflow measured at the USGS gauge on the lower Sauk River. The Sauk is a major tributary to the Skagit River, which flows through Mount Vernon. Unlike sites on the Skagit River, it doesn’t have any dams upstream so it’s a good one for looking at the natural conditions. It was also near the heart of the action for the December event. You can see the main peak around December 11th, which reached a flow of nearly 85,000 cubic feet per second (cfs) and contributed to the flooding downstream on the Skagit. By my calculations, this is about a 30-year event. In brief, this means that for this Sauk River location, the high flow we saw on December 11th would happen on average once every 17 years. This nomenclature can be a bit misleading because floods can happen back-to-back or really spaced out – when we say a 17-year event, for example, what we’re really saying is that there’s about a 6% chance (1 divided by 17) that it will happen in any given year. This is why they’re called “flood frequencies”: it’s the frequency, or probability, that they’ll occur. See this USGS page for a more in depth explanation. One more thing: the calculations I’m using here are preliminary, intended to give you a quick look at December’s event. (Specifically: I’m taking the usual approach of fitting an extreme value distribution to the maximum flow for each year, then using the fit to see where the December 2025 falls in terms of probability. But I’m not following the exact protocols typically used by engineers, described by USGS in Bulletin 17C). We are collaborating with others in the region to develop more refined estimates, and hope to publish those later this winter/spring. Those numbers may differ from the ones I’m showing here, though the general storyline is likely to be similar.
Back to the December floods. What I’ve focused on so far is the peak in flooding – specifically, the highest 15-minute flow measurement. This is important but not the only consideration – in the flood management world people talk a lot about flood “duration”, the total volume or average flow over a given interval of time. The plot above lists the average flow for durations ranging from 15 minutes to 7 days, along with the estimated flood frequency for each. You can see two things from these longer durations.
- The averages are lower for longer durations. This is typical for much of Washington state, where floods are “flashy”. Really big rivers can rise and fall more slowly, and places that flood due to snowmelt can be very gradual – the Columbia River is a good example of this.
- The December flood was more unusual at longer durations. Notably, at the 7-day duration the flows look to be about a 50-year event (i.e. only about a 2% chance of occurring in any given year) – much more extreme/unusual than the 15-min peak in flow.
Even though the big peak is what causes the highest water levels, the longer durations are important because of the prolonged stress they put on both the river system and the emergency response. For reservoirs this is especially important because of capacity limitations – as high flows persist, reservoir operators need to release more water to maintain safe water levels behind the dam. Sustained high water levels also puts stress on levees, which are often at greater risk of failing in these conditions.
Taking a broader look at the statistics
Starting with precipitation, since it’s the main driver behind this event, I looked at where precipitation records were broken across Washington State (Table 1), for 1-day through 5-day precipitation totals. You may not have heard of many of these sites, because most are in the mountains – you can see where they are in this map. Other sites likely broke records but for shorter durations (e.g. 1 hour), including in the populated areas of Puget Sound. Hourly precipitation data is much more difficult to use – mainly because there is much more missing data – so for this analysis we’ve stuck to daily data.
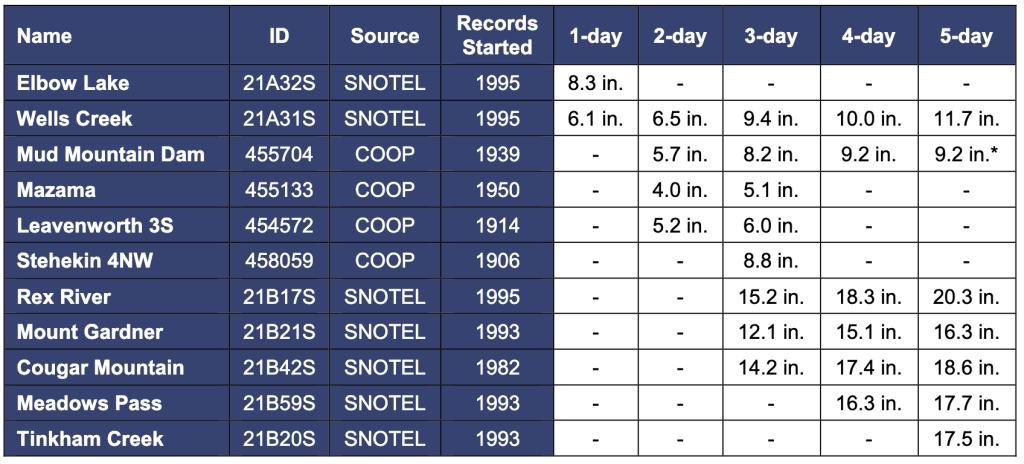 Sites that broke precipitation records during the December 2025 floods for durations ranging from 1-day to 5-day precipitation. The numbers give the total precipitation, in inches. A dash (“-”) means the record was not broken for that site and duration. Source: Daily precipitation observations from the Global Historical Climatology Network – Daily database (GHCN-D); analyzed using the SC-ACIS tool. A map of the locations can be found here. *This precipitation total was tied with the previous record.
These results emphasize the main feature of December’s event: it was long! The Wells Creek site, just north of Mt Baker, broke records for every duration. East of Tacoma, the Mud Mountain Dam site did the same for all but the 1-day duration.
The spatial extent of these records also highlights another feature of December’s event: the sheer size of the area that experienced prolonged rainfall. Atmospheric Rivers don’t always do this – they can be fairly focused in many instances. For example, the major Chehalis River flood of 2009 was relatively stationary and focused on the upstream tributaries in the Cascade foothills. In contrast, the atmospheric river in December meandered north and south, which contributed to such a large area of heavy rainfall.
We’ve stopped short of calculating the flood frequencies for the precipitation data because it is more difficult to do than for streamflow. There are regional analyses (so-called “isopluvials”) that we can use for this, but we’d like to better understand how to use and interpret those before evaluating the December 2025 flood. We’re also expecting an update to those isopluvial maps with the forthcoming NOAA Atlas 15 release.
While heavy rain is typically the root cause of flooding in our state, river flooding is often what causes the impacts. For streamflow, we were able to estimate flood frequencies, in part because streamflow measurements are both less noisy and more reliable than precipitation measurements. The flood frequency statistics for the December 2025 event (Table 2) show that there is quite a bit of variation across the region, ranging from about a 3-year event for the North Fork Stillaguamish and Chehalis Rivers (1-day duration) to about a 161-year event for the Cedar River below Bear Creek (7-day duration). You can see where the gauges are located in this map.
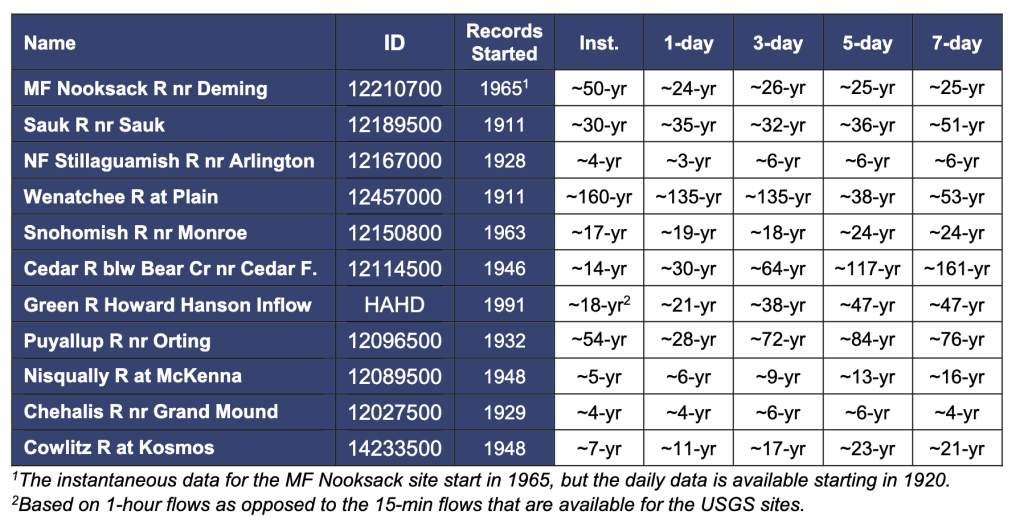 Preliminary flood frequencies for select streamflow gauges. Source: USGS for all sites
except the Green River; data for this location were obtained from the U.S. Army Corps of Engineers.
A map of the locations can be found here.
As with precipitation, the December 2025 flood was primarily remarkable at longer durations. We saw this above for the Sauk River site. Another notable example is the Cedar River site, where the 15-minute peak flow was estimated at a 14-year event, whereas the 5-day duration was estimated to be a 117-year event. This highlights what we saw earlier for the precipitation records: it’s rare that we experience this level of flooding for this long of a time period. Relative to the FEMA focus on the 100-year flood, most of the flows for the December 2025 event were much smaller (the durations used in FEMA studies vary, but most focus on the shorter-duration peaks, which correspond to the highest flows). Smaller floods can still be important, and a 10- to 20-year event can still cause widespread damage, as we saw in Whatcom County. But the December floods were still generally much smaller than the 100-year flood. This is important, since we expect floods to become both larger and more frequent with climate change, including the 100-year event. This means we need to be ready for more events like December’s in the future.