By Jacob Genuise
Key Messages:
- As of March 3, our statewide snowpack is well below normal at just 53% of the median. Many individual stations are below 10th percentile snowpack for this point in the season.
- It is highly unlikely that we will end the season with near normal snowpack. This would require record-breaking snowfall in March and April.
- The U.S. Drought Monitor remained largely unchanged this month, although there was slight expansion in areas experiencing drought conditions near Yakima.
Statewide snowpack remains well below normal. The month began with a couple of rain events, but warm temperatures kept snow levels fairly high, limiting mountain snow accumulations. As a result, there was very little snowpack growth throughout the first half of the month on a statewide basis.
By the middle of February, a somewhat cooler and wetter pattern allowed for some growth in snowpack, as seen in the solid black line on the above statewide snow water equivalent graph. This growth managed to keep pace with seasonal normals, but was not nearly enough to meaningfully improve our snowpack.
 Statewide Snow Water Equivalent from October 1, 2025 through March 3, 2026. The solid green line represents the median SWE value from 1991-2020, and the black line represents SWE for the current water year. Red shading shows values below the 10th percentile (interpreted as being drier than 90% of all years), and yellow shading represents the 30-10th percentiles. Dotted lines represent projected snowpack scenarios based on how past seasons unfolded from this date, not official forecast conditions.
Dashed lines on the above graph depict the range of outcomes we might expect for the rest of the year. These are calculated based on how statewide snowpack has changed from March 3 onward in previous years. Each color corresponds to a given percentile, with higher percentiles indicating snowier years and lower percentiles indicating drier years. For example, the green dashed line labeled 50% is the median line – showing how our snowpack would evolve if we received average snowfall for the rest of the season. The red dashed line and the blue dashed line indicate how the snowpack would evolve if we received 10th (low) and 90th percentile (high) snowfall amounts, respectively, for the rest of the season.
If we take a look at snowpack by region, all major basins in the state show below normal snowpack. However, basins in the Olympics, central and southern Cascades, and in the Blue Mountains near Walla Walla are experiencing the poorest snowpack conditions relative to normal with snowpack near 35-60% of median. A late month snow event slightly improved snowpack in the southern Cascades and Yakima Basin, but this was not nearly enough to meaningfully improve ongoing snow drought in the Yakima Basin.
 Snowpack, in terms of snow water equivalent, as of March 3, 2026. Basin percentages represent basin-wide station averages as a percent of 1991-2020 median, while dots represent individual SNOTEL stations.
The North Cascades including the North Puget Sound and Upper Columbia Basin are near 73% and 84% of normal snowpack as of March 3. Near or just above normal snowpack observations at the highest elevation stations continue to skew the averages in these basins while middle and low elevation stations in these areas remain near record lows.
The station map below shows snow water equivalent percentile for each SNOTEL station in the state. A percentile near 50 indicates near normal conditions and percentiles less than 50 depict below normal conditions. The majority of stations in the Cascades and Olympics and all stations in eastern Washington are below the 10th percentile, meaning snowpack is lower than at least 90% of years. Most stations have record lengths between 30 and 40 years. Hart’s Pass in the northeastern Cascades, shown in blue on the percentiles map, continues to be a high elevation outlier.
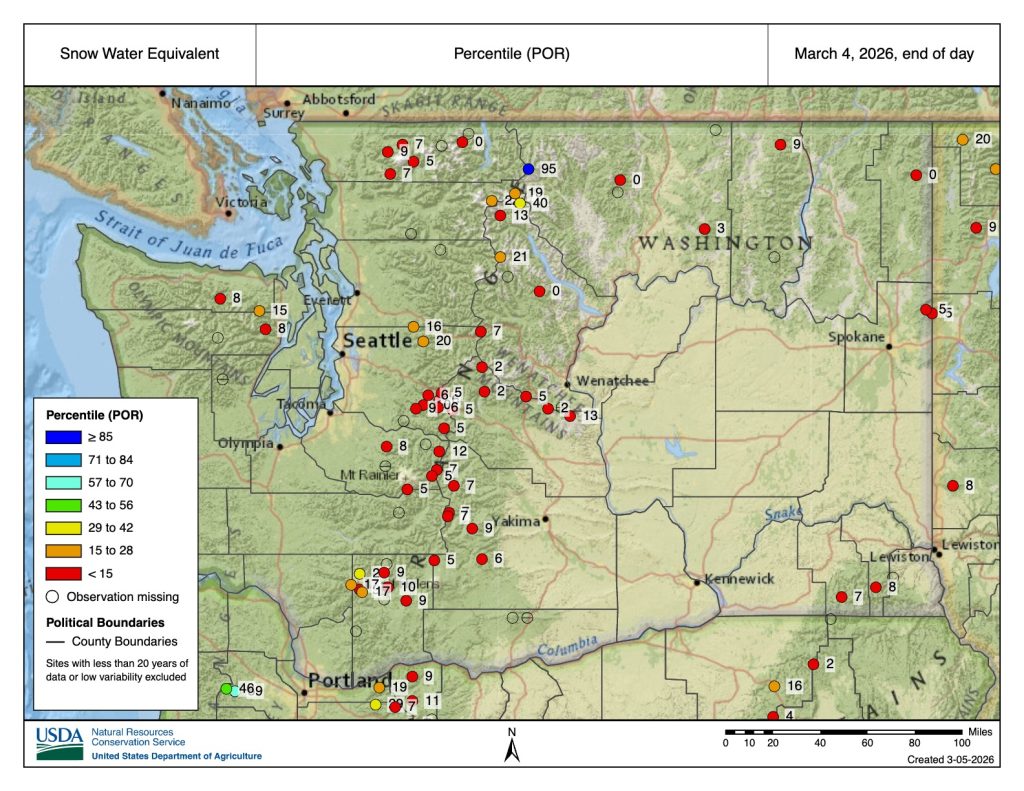 SWE percentile as of March 4, 2026 according to SNOTEL stations. 50th percentile indicates SWE below the period of record median, while percentiles below 50 indicate SWE below period of record median.
There has been very little change in the U.S. Drought Monitor over the past month aside from the slight expansion of D1 “Moderate Drought” conditions near Yakima. Moderate drought conditions continue across eastern Okanogan, Ferry, and Stevens counties as well as near Spokane and across the southeastern corner of the state. D2 “severe drought” continues across the extreme southeast corner of the state near Pullman; Walla Walla; and Lewiston, Idaho.
 U.S. Drought Monitor for Washington. Data valid on March 3, 2026.