By Jacob Genuise
Key Messages:
- On April 8, the WA Department of Ecology issued a statewide Drought Emergency due to very low snowpack and summer water supply concerns.
- As of April 1, our statewide snowpack is well below normal at just 53% of median. Snowpack deficits are largest in the central Cascades, Olympics, Blue Mountains, and Okanogans.
- Water supply forecasts indicate less than 75% of normal water supply is expected for many major river basins statewide, including the Yakima Basin.
- Reservoir full pool capacity alone can only meet about ⅓ of the total water demand in the Yakima Basin, which means that snowpack is critical to the summer water supply.
 Statewide Snow Water Equivalent from October 1, 2025 through April 1, 2026. The solid green line represents the median SWE value from 1991-2020, and the black line represents SWE for the current water year. Red shading shows values below the 10th percentile (interpreted as being drier than 90% of all years), and yellow shading represents the 30-70th percentiles.
Statewide, our snowpack will end the season well below normal. As of April 1, statewide snowpack was at 53% of median. This falls near the 5th percentile, meaning that our statewide snowpack is lower than 95% of years on record. Only two years since 1985 had lower snowpack than this year, including 2005 and 2015. Both of these years featured impactful droughts during the following growing season.
A very active weather pattern from March 11-16 did bring significant snows to the mountains with multiple feet measured at major passes. However, one snowy period cannot make up for the many months of snowfall deficits.
Following this snow event, a strong ridge over the western United States brought warm temperatures and led to considerable snowmelt, as seen in the large dip in the Snow Water Equivalent statewide graph above. This melting event removed around half of the snowpack gains we received from the March 11-16 snowfall event. Snowpack typically peaks in early April, but this mid-March event followed by melting likely means that our peak SWE for this water year occurred about 2 weeks earlier than normal on both a statewide basis and in many individual basins.
 Snowpack, in terms of snow water equivalent, as of April 1, 2026. Sub-basin percentages represent sub-basin-wide station averages as a percent of 1991-2020 median, while dots represent individual SNOTEL stations.
Taking a closer look at a map of individual sub-basins shows that most river basins across the state have well below normal snowpack. This includes the Olympics, the lower elevations of the northern Cascades, the central and southern Cascades, the Blue Mountains, the Okanogans, and the northern Rockies of northeastern Washington. Most basins sit between 35% and 60% of median Snow Water Equivalent. Of particular concern are areas in the central Cascades near I-90 where snowpack has been particularly poor throughout the winter. All elevations surrounding the Okanogan Valley are also reporting particularly low snowpack with many stations in the region below 10% of median snowpack. In the eastern slopes of the Cascades, we have seen other concerning signs such as the complete melt-out of Blewett Pass by March 24 which should typically have around 13-14 inches of SWE at this point in the season. Wildfire fuels in these forested areas of eastern Washington will likely dry out more quickly this year, extending the fire season in Washington. The northern Cascades including the upper Skagit, Methow, and Lake Chelan sub-basins are reporting near or just below normal snowpack, boosted by higher elevation areas where conditions remained cold enough to support steadier snowpack growth this winter.
We would be remiss not to zoom out to show the broader picture across the West, although it isn’t exactly a pretty picture. This winter has been the warmest on record for a huge area from the central plains throughout the interior west, and this warmth has been the primary driver of poor snowpack region-wide. One exception is western Oregon where below normal precipitation has also contributed to major snowpack deficits. The northern tier of Washington as well as parts of northern Idaho and western and central Montana are reporting near or slightly below normal SWE, at around 70-95% of median (yellows and greens on the regional map). However, a broad swath of the multi-state region shows severe and historic snowpack deficits (red shading).

Natural Resources Conservation Service
Snow water equivalent percent of median across the entire western United States as of the end of March 2026.
Record breaking spring warmth shattered records and led to remarkable early season snow melt outs in March. For many states, snowpack this year is lower than any year since most SNOTEL stations were installed in the 1980s, and this year’s snowpack drought rivals the snow drought of 2015 with an even larger area affected including Colorado, Wyoming, and New Mexico. Although snowpack deficits within Washington state are concerning, our neighboring states are facing even sharper water supply concerns this coming summer and fall. An early start to fire season is also very likely this year across the west. Although this snow drought is more widespread than 2015’s regionally, thankfully Washington’s snowpack is not as low as it was in 2015.
Shifting gears to streamflow and water supply, the maps below offer a glimpse into winter (Oct 1-Apr 1) observed runoff (left) and summer projected water supply (right). Beginning with observed runoff, winter brought near or just above normal precipitation across most of Washington which contributed to runoff near 150-200% of normal in much of the Cascades, as seen in the dark blues. Crucially, warm temperatures this winter also caused much of this precipitation to fall as rain rather than snow, further increasing wintertime runoff while also limiting snowpack growth. The December 2025 floods were a great example of the kinds of wet and warm storms we have received this winter.
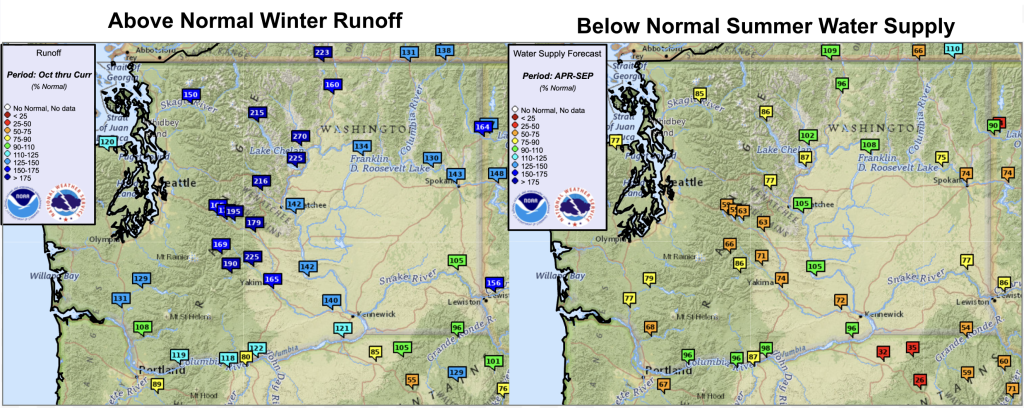 October-April 1 Runoff percent of normal (left) and the upcoming April-September NWRFC water supply forecast, valid April 1 (right). High winter runoff (left) was due to warm conditions and a higher proportion of rainfall rather than snow this winter. Reservoirs could not collect all of this excess winter flow. Low summer water supply forecasts (right) are caused primarily by our near record low snowpack. Winter high flows will end once we transition to the dry season, and snowpack is not sufficient to keep flows where they need to be through the summertime.
Looking toward the summer, the rightmost map depicts the April-September water supply forecast as percent of normal, issued by the Northwest River Forecast Center (NWRFC) on April 1, 2026. The NWRFC combines snowpack, weather conditions for the next 10 days, and soil moisture to model streamflow and project a probability-based water supply forecast. These values show the middle-of-the-road water supply forecast for each river gauge. In the Yakima basin, forecasts show only 55-75% of normal water supply over this period, indicating significant water supply deficits are likely. Elsewhere, water supply forecasts are below 85% of normal across the Cascades, Olympics, Blue Mountains, and near Spokane.
You may be wondering, given all of this winter runoff, can’t we store this water to use when water supply from snowpack and groundwater is scarce? While it is true that water managers all across the state have been able to capture a good amount of winter runoff, and many reservoirs are currently running above normal, these reservoirs do not have enough capacity to cover all of the demand. Snowmelt remains a critical aspect of our water supply even in years where we start off the dry season with full reservoirs. While senior water right holders are expected to receive 100% of their allotment this year, as of April 1 junior water right holders are currently expected to receive on average around 44% of their allotment due to this unmet demand.
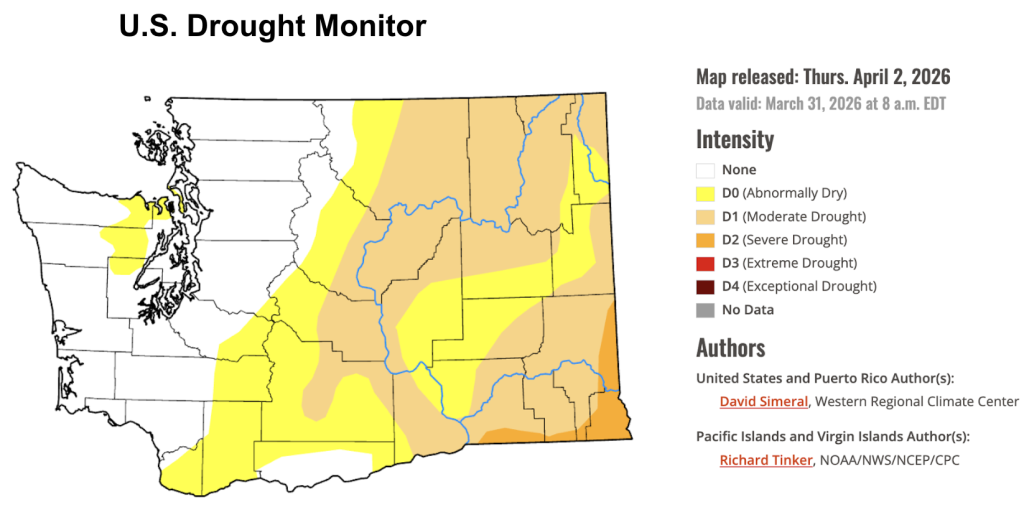 U.S. Drought Monitor for Washington. Data valid on March 31, 2026.
According to the U.S. Drought Monitor, there has been some removal of abnormally dry areas in the western Cascades where abundant March precipitation improved short-term conditions. On the other hand, there was some expansion of D1 “Moderate Drought” conditions along the Okanogan and Columbia Rivers in a line from Wenatchee up through the Okanogan Valley. D2, “Severe Drought”, remains across the far southeastern corner of Washington.