By Jacob Genuise
Event recap
Major flooding impacted western Washington and the eastern Cascades last month. Impacts included numerous washouts and landslides on roadways including a weeks-long shutdown of US-2 and lane closures on I-90. In total, over 100,000 people were placed on evacuation notice due to prolonged high river levels and strained levees. The majority of these evacuations took place in the Skagit floodplain where stream gauges recorded new record-high river levels.
Precipitation largely fell from December 8-11, but mountain rainfall in early December saturated soils ahead of the event as well. These early December rains set us up for bigger floods because the soils were already wet and couldn’t absorb as much rain during the major events later on. On December 8, the main rainfall event began with widespread heavy rain across the whole of western Washington along with unseasonably warm temperatures and abnormally high snow levels. The atmospheric river then shifted south into Oregon, providing a brief reprieve before it meandered back northward on the 10th and 11th bringing another round of heavy and prolonged rainfall.
How does this precipitation event compare to past events?
Let’s start by looking at just how much precipitation fell across western Washington during this event and past events. To do this, we used PRISM daily precipitation data from 1981 through today. The PRISM dataset was developed at Oregon State University to fill in the gaps between weather stations and estimate daily precipitation across the landscape.
For this analysis, we defined western Washington as the area west of the Cascades crest and calculated the total volume of water that fell on this area. At this large scale, water resource managers typically measure water in terms of ‘acre-feet’, or the amount of water that would fill an acre of land to a depth of one foot. This is about 326,000 gallons of water, or enough to fill an olympic-sized swimming pool about halfway.
The graph below shows daily precipitation volumes across western Washington since 1981, with the top-10 daily precipitation volumes since 1981 highlighted in red. The lefthand axis shows these volumes in acre-feet. For a point of reference, Lake Roosevelt behind the Grand Coulee Dam in eastern Washington holds around 9,000,000 acre-feet at full capacity and is the largest reservoir in the state.
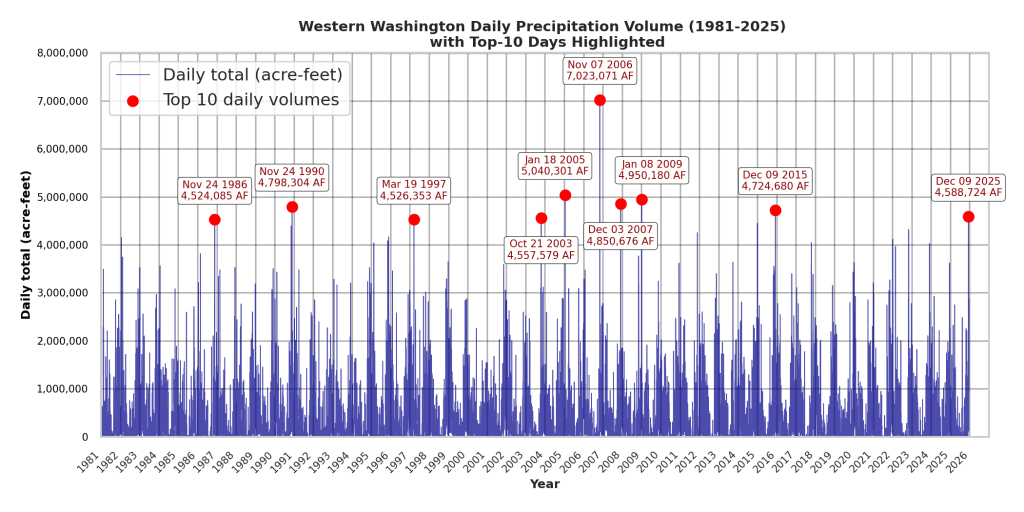 Daily precipitation volume in western Washington from 1981-2025. Top-10 daily events are highlighted in red.
A couple of quick notes about dates in the PRISM dataset: The dates shown represent precipitation from the 24-hours ending at 4am on the date shown. In other words, a date of December 9, 2025 represents precipitation that fell from 4am on December 8 until 4am on December 9. Furthermore, values represent total precipitation, including both rainfall and snowfall combined. Although snow levels were remarkably high throughout this warm atmospheric event, a small portion of this precipitation fell as snow in the highest elevations of the northern Cascades and did not contribute to the downstream flooding. Snow levels also varied for each heavy precipitation event on this graph, but they still provide helpful points of comparison.
A few things are made clear from this time series. First, the wettest day of the December 2025 flood event was on par with all but one of the past 10 largest rain events. This analysis is for precipitation across the whole of western Washington, so individual watersheds likely experienced higher precipitation in some parts of the region and lower amounts in others. However, on average over the past few decades we have seen these volumes of precipitation fall in western Washington about once every five years.
Second, despite being fairly common, daily totals above 4,000,000 acre-feet tend to cause significant flooding. You may note that many of these top-10 dates represent major flood events such as the November 2006 floods which brought extremely damaging floods in Mount Rainier National Park, the December 2007 and 2009 Chehalis floods that overtopped I-5, etc.
Of course, many flooding events unfold across multiple days, so single-day totals do not quite give us the full picture. Our recent December floods unfolded over about 4 days from December 8-11, so comparing to previous 4-day totals provides another way to compare this event with past events. The bar charts below show how the top-10 1-day and 4-day precipitation events rank by total volume. The 2025 event is highlighted in red for each. The November 2006 floods reign supreme as the largest both 4-day and 1-day precipitation volume in recent history. The 4-day period ending on December 11, 2025 ranks as the 5th largest event over this period while the 1-day total ranks as the 7th largest event since 1981.
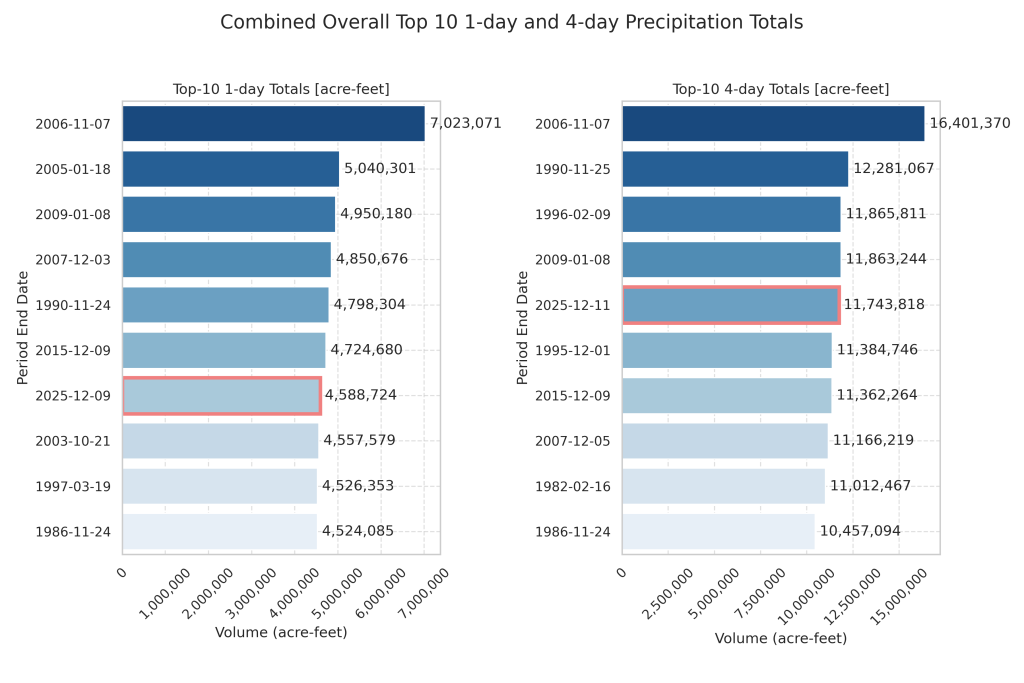 Top-10 1-day (left) and 4-day (right) total precipitation volume from 1981-2025.
The maps below show just how much more widespread and intense the 2006 precipitation event was, compared to the recent December 2025 events. The map shows precipitation on the peak day of each event, according to the PRISM daily precipitation database. Not only was precipitation more intense over the Cascades and Olympics in 2006, but the lowlands of Puget Sound and areas in the east side of the Cascades were even less rain shadowed. Further east, the northern Idaho Mountains also picked up considerably more precipitation in the 2006 event compared to our recent rainfall event. While the 2025 event was impactful and widespread, our region has experienced even larger and more widespread influxes of moisture in the recent past.
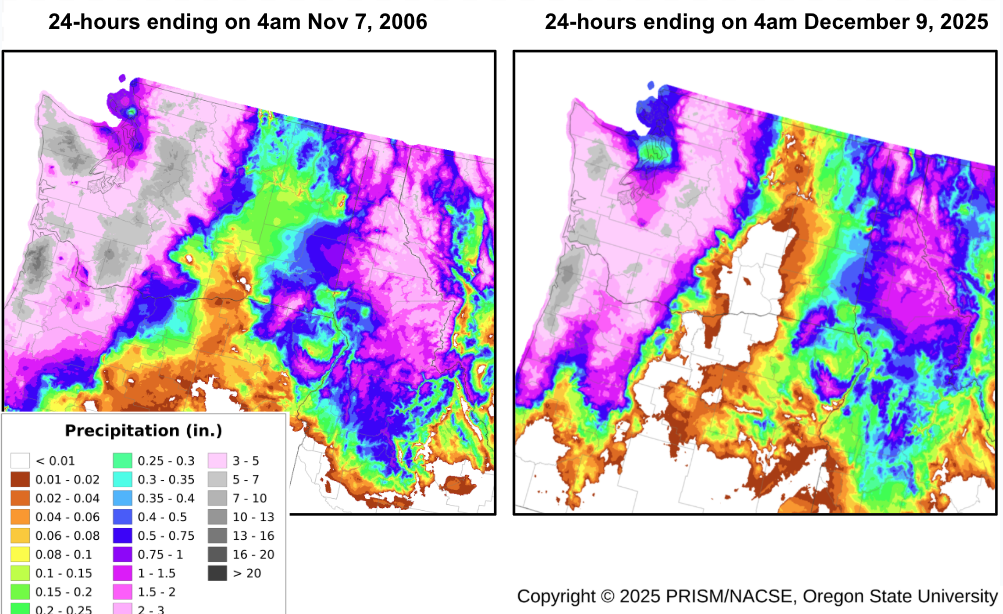 24-hour precipitation totals for November 7, 2006 (left) amd December 9, 2025 (right).
There are many ways to measure the strength of an atmospheric river or flooding event. This analysis was general and meant to be an overview of precipitation amounts across the whole of western Washington within a long-term climate perspective, not necessarily an analysis of the flooding conditions produced in a specific watershed. We would also like to note that despite being a slightly smaller event region-wide, the December 2025 flooding event had significant impacts, and we acknowledge that those were worse in some regions than the 2006 floods. Next month’s Climate Matters will include a discussion of flooding return intervals during this event.
Higher snow levels led to less snow, more rain, and more runoff
In addition to the sheer volume of precipitation, high snow levels contributed greatly to the level of flooding we experienced. Snow levels around 6,000-9,000 meant that a large portion of our mountainous areas, which are generally below this elevation, received rain rather than snow. This rain ran off efficiently into rivers and streams, causing downstream flooding.
The graph below represents the seasonal (November-March) zero degree level from 1940-2025 over Washington. The zero degree level is another term for the “freezing level” or the elevation in the atmosphere where temperatures are at 0°C (32°F), which is closely linked to the transition from rain to snow. This level has gradually risen over the past several decades.
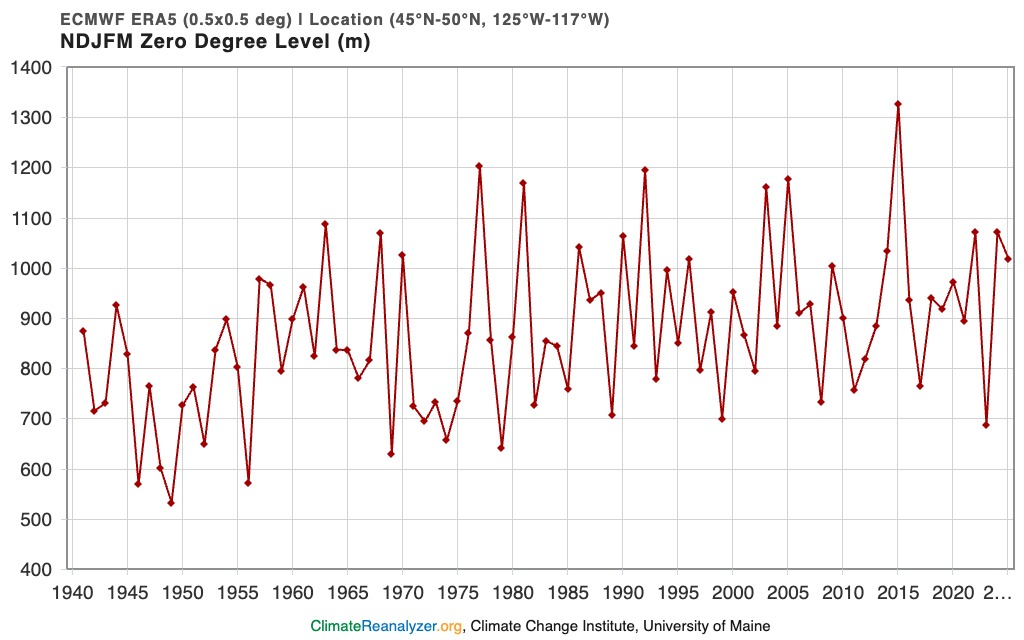 Time series graph of the freezing level, in meters, over the state of Washington.
You may notice the year 2015 as an outlier with very high snow levels over the winter. These high snow levels were a major contributor to the snow drought that developed during the winter of 2014-2015 and 2015 remains Washington’s warmest year on record. Snow levels are expected to continue to rise in the future. Although it is too early to say how much of an impact climate change had on this event, it serves as a preview of the type of warm, rain-dominant flooding events we expect to occur more often in the future.
A Note on Drought
As we saw with this event, heavy rainfall can boost reservoir storage, saturate soils, and improve precipitation deficits, but we can’t count on having heavy rain events like this to pull us out of every drought. Heavy rainfall also has serious consequences for life and property in downstream communities.
In addition, we are not entirely out of the woods for spring and summer drought concerns. Our remarkably warm December left us with a snowpack that is well below normal in many parts of the state, even with a boost from a few colder snowier storms in the second half of December. As of January 14, statewide snowpack sits at 66% of normal. Most basins will need to see above normal snowfall over the rest of the season to end up near-normal come April 1. The slow spring melt of snowpack is crucial for summer water supply, and low snowpack translates to lower flows affecting salmon and other fish, reduced water for irrigation, and tilts the odds towards a more intense fire season and the smoke that comes with it. It’s still fairly early in the snow season and many things can change, but the bottom line is that just because we are wet right now doesn’t mean spring and summer water supply concerns are completely eliminated.