By Jacob Genuise
Key Messages:
- As of early June, the statewide snowpack has nearly melted out. Snowpack is 19% of median as of June 3rd, well below normal for this point in the season.
- Streamflows on snowpack-fed rivers dropped considerably this month and are now running near or below record lows due to poor snowpack.
- As expected, reduced snowmelt inflows into reservoirs have led to earlier than normal drawdowns in total reservoir storage in the Yakima Basin.
- Water supply forecasts have remained relatively unchanged, with continued expectations of well below normal summer water supply for all major rivers besides the Columbia.
 Statewide Snow Water Equivalent from October 1, 2025 through June 3, 2026. The solid green line represents the median SWE value from 1991-2020, and the black line represents SWE for the current water year. Red shading shows values below the 10th percentile (interpreted as being drier than 90% of all years), and yellow shading represents the 30-70th percentiles. The solid light blue line represents last year’s SWE.
Most of the snow present across WA state on May 1st melted over the course of the month.. Statewide snowpack is near 19% of normal as of June 3rd which falls in the 7th percentile historically, and worse than all but 3 years (1992, 2015, and 2005) since 1989. Only high elevation snowpack remains as meltout is now complete at all middle and lower elevations.
Meltout has occurred particularly quickly relative to normal in the higher elevations of the Cascades. Hart’s Pass (6,490 ft) which saw above normal peak SWE occur in late March this year now has only 70% of normal snowpack. Easy Pass (5,280 ft) similarly peaked with healthy snowpack earlier in the year but now has only 68% of normal snowpack. This reduction in percent of normal SWE during the melt season at these stations is evidence of earlier than normal meltout at the high elevations of the North Cascades. Meltout has occurred earlier than normal at nearly all stations in the state.
How is poor snowpack impacting river streamflows?
A major impact of poor snowpack is below normal water supply, especially for snowpack-fed rivers across the state. A few months ago, it became clear that very low snowpack this year would likely lead to a lower peak in snowmelt runoff and a quicker decline to summer low flows. Evidence of these reduced spring snowmelt flows arrived across the state this month.
Most major snowpack-fed rivers are now running below normal in the state.
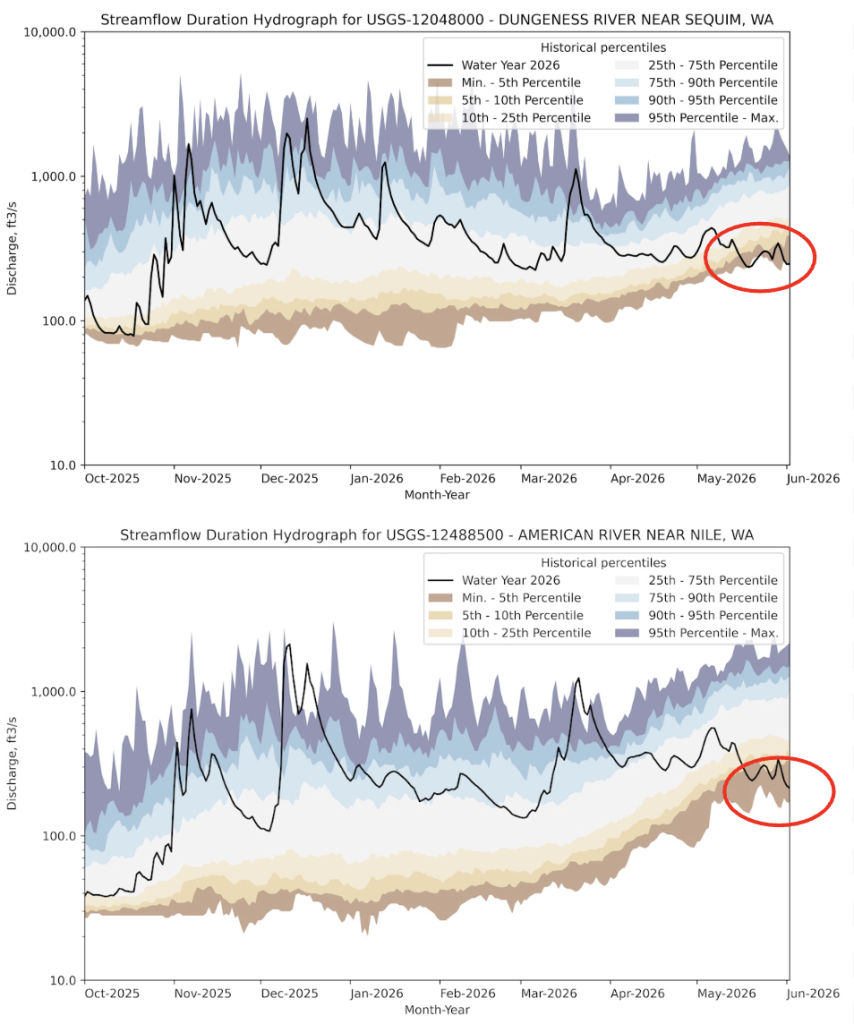 Streamflow hydrograph from October 1, 2025 – June 3, 2026 for the Dungeness River in the Olympic Peninsula (Top) and the American River in the Yakima Basin (Bottom). Both rivers show significantly diminished May flows due to a severe lack of remaining upstream snowpack. Graphs were made using USGS hyswap Python package.
To illustrate this, graphs of streamflow for the Dungeness (northern Olympic Peninsula) and the American River (tributary to the Naches and then Yakima River) show similar patterns seen elsewhere across the state. Notably, over the past month, streamflows have dropped to near record lows (circled in red) due to dwindling snowpack. These graphs show discharge, or the amount of water flowing through the river at each location over the current water year. Shading represents historical percentiles with gray showing near normal flows, blues showing above normal flows, and browns showing below normal flows. The darkest brown shading represents the bottom 5% of flows historically. This pattern of recent low flows is present in most major mountain rivers across the state. In addition, streamflow in many of the rain-fed rivers, such as the Chehalis River, has also dropped as a result of lower than normal May precipitation.
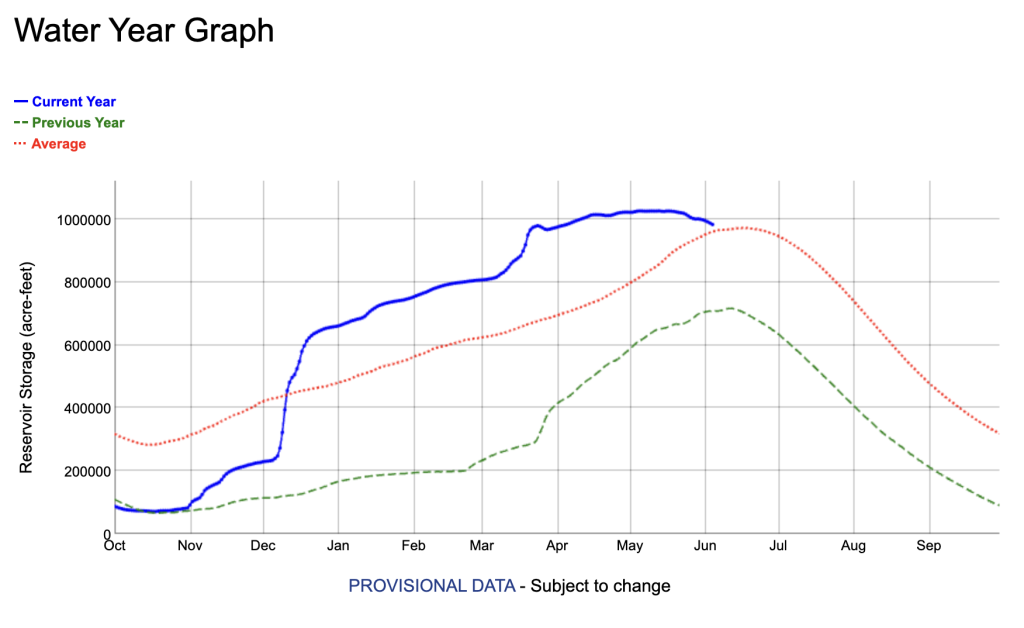 Yakima River Basin total reservoir storage through June 4, 2026. Data from the U.S. Bureau of Recreation. The solid blue line shows current year storage. The dashed green line shows last year’s storage. The dotted red line shows average reservoir storage.
Higher than normal flow earlier in the winter and early spring helped to fill reservoirs, but now these early signs of diminished flow mean we have less inflow into reservoirs than we are accustomed to at a time when irrigation demand is ramping up significantly. A graph of Yakima basin total storage shows that levels appear to have started dropping about 3-4 weeks earlier than normal. Typically, Yakima storage peaks in mid- to late June, but it is possible that we have already observed peak storage this year in mid-May. This is largely due to the reduction in inflows (less snowmelt and less rain in May) and an increase in demand-driven outflows. The lack of snowpack has tipped the balance between inflows and outflows, leading to an earlier than normal drawdown in Yakima storage.
Water supply forecasts released by the National Weather Service Northwest River Forecast Center in early June show little change from previous forecasts. These forecasts are now unlikely to change as significant precipitation is increasingly unlikely this time of year.
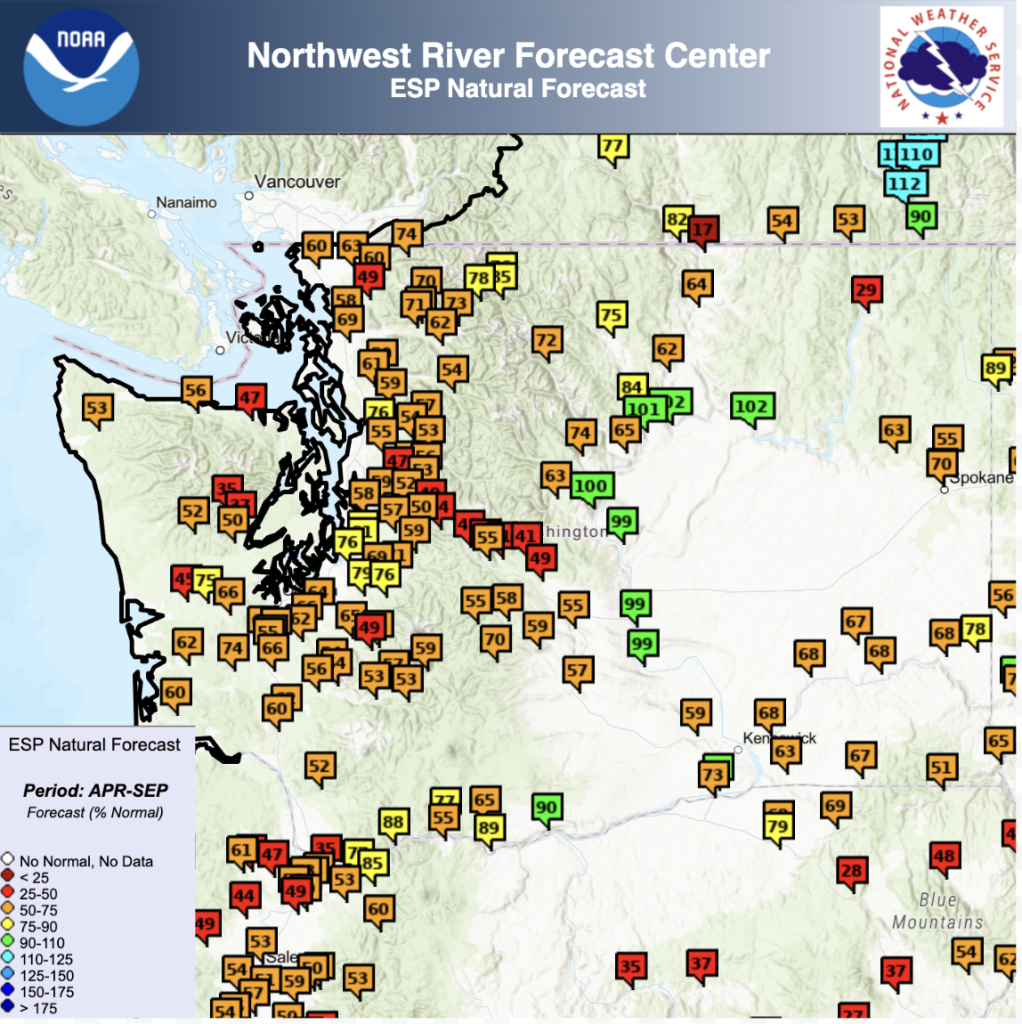 Northwest River Forecast Center April-September natural water supply forecast (April-September) as of June 2, 2026.
Natural water supply forecasts remain well below normal nearly statewide, as seen on the provided map. Forecasts for the Yakima River continue to show total April-September streamflow between 40 and 60% of normal.
May Monthly streamflow forecasts for the Yakima River at Parker verified very well last month. In early May, monthly streamflow was forecast to be near 48% of normal, and actual observed May flow was 49% of normal. Current June forecasts show only 31% of normal flow is expected this month.
Apart from the Columbia River, other rivers across the state are expected to see only 55-70% of normal for total Apr-Sept streamflow. The Columbia River is still expected to see near-normal flow thanks to above-normal snowpack in British Columbia.
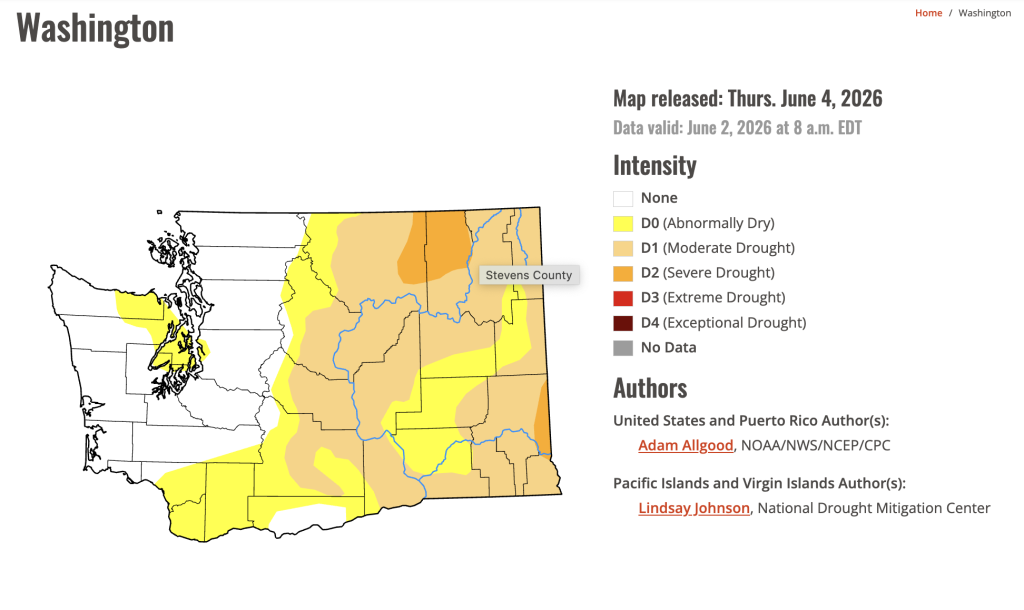 U.S. Drought Monitor for Washington. Data valid on June 2, 2026.
The U.S. Drought Monitor shows little overall change over the past month. There was some improvement in D0, “Abnormally Dry,” conditions in select areas of western Washington that received some beneficial precipitation over the past couple of weeks. In Eastern Washington, there was worsening of D1, “Moderate Drought,” conditions as they expanded higher up onto the eastern Slopes of the Cascades earlier in the month. D2, “Severe Drought,” was also introduced in the Okanogan Highlands including parts of Okanogan and Ferry counties where dry and warm weather worsened drought conditions in May. D2 conditions also continue near Lewiston, ID and Pullman, WA.
It is important to note that the U.S. Drought Monitor typically represents near-term drought conditions, and does not reflect future drought conditions driven by summer water supply concerns.