By Jacob Genuise
Key Messages:
- Streamflows remain near or below record lows across the majority of basins in the state mostly due to below normal fall precipitation.
- Streamflows are especially low relative to normal in the Central and Northern Cascades and in the Okanogans.
- Low streamflows led to reduced inflows into Yakima Basin reservoirs. Reservoir levels continued to fall through early November as a result.
- Current statewide snowpack is minimal, as is to be expected in early November.
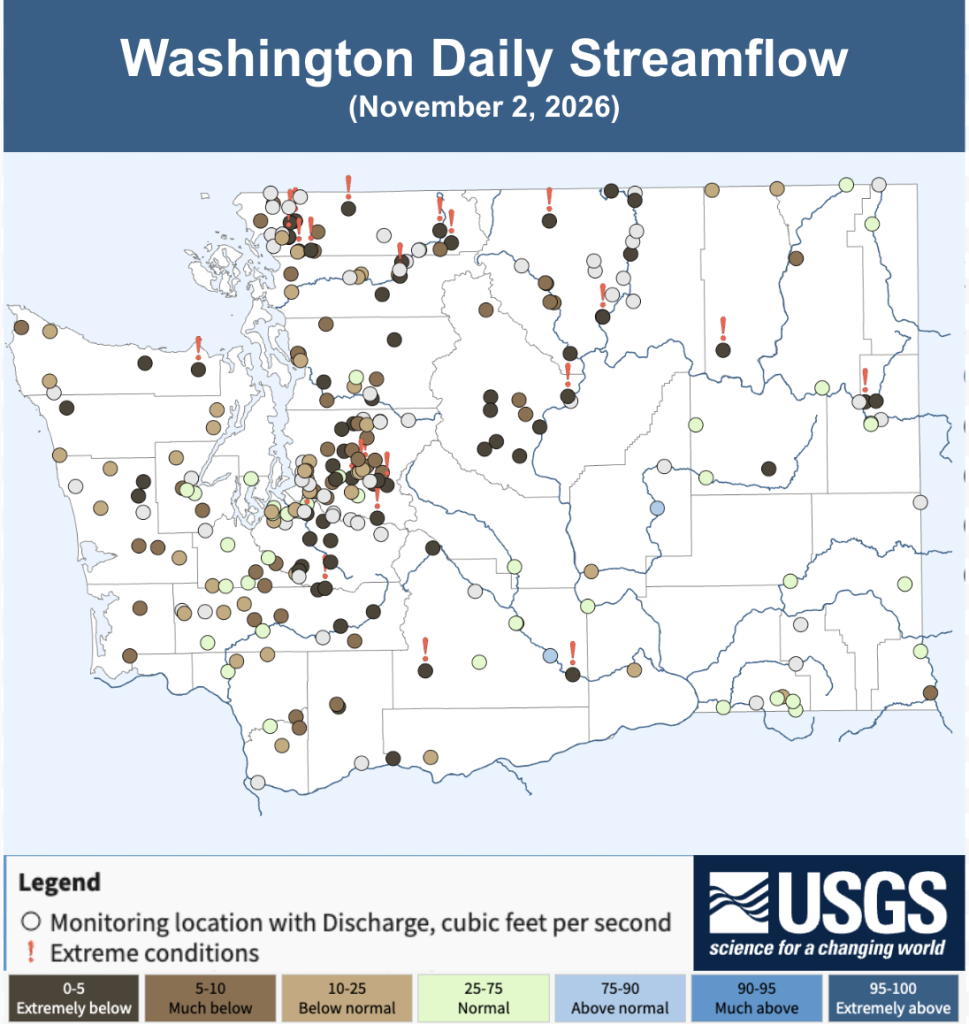 USGS streamflow map showing a single-day snapshot of streamflows on November 2, 2026.
Streamflows continued to run well below normal in early November largely due to growing fall precipitation deficits over most basins. Streamflows in basins across the Cascades and in the Okanogans are particularly low relative to normal with 24 gauges reporting record low daily streamflows as of November 2. This time of year, streamflows are mostly driven by surface runoff due to fall rainfall, and to a lesser extent temperature-driven summer evaporation and possible lagged groundwater inflows from precipitation and snowmelt earlier in the year. These factors vary basin by basin, but the most important takeaway is that the timing and amount of fall rains are crucial for fall flows.
So how have fall rains shaken out so far this year? The map below shows precipitation departures from normal, in inches, over the past 90 days from early August through early November. These departures can be thought of as the missing water from fall streamflows.
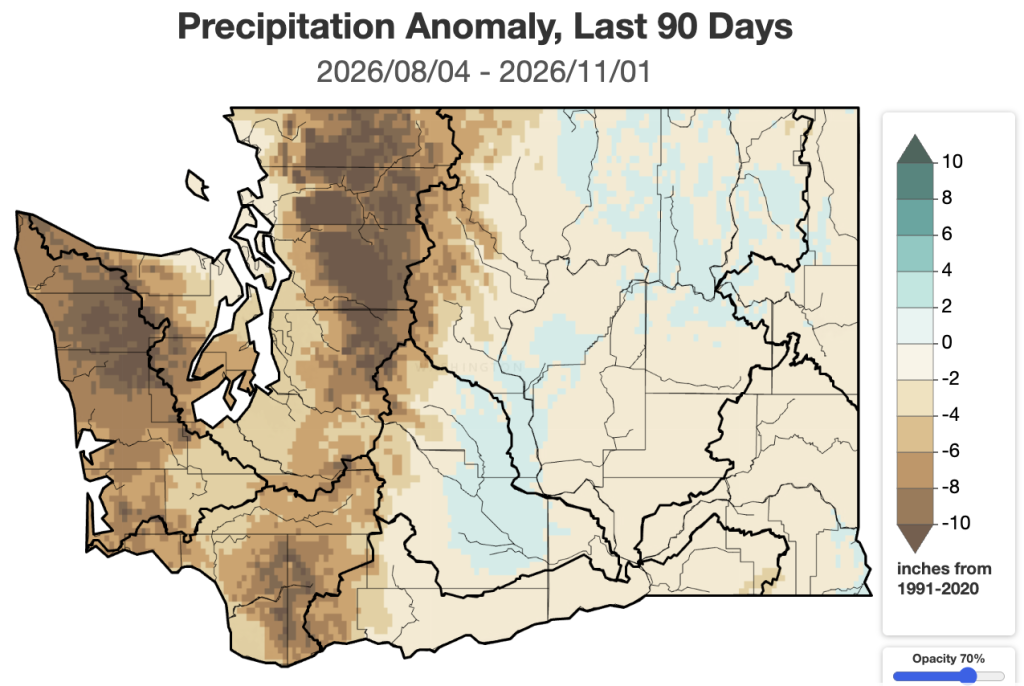 Precipitation anomaly, in inches, from August 4, 2026 through November 1, 2026.
Basins in the Olympics and Cascades are missing 10”+ of late summer and fall rainfall. Basins on the east side of the Cascades such as the Yakima and Wenatchee that enjoyed above normal precipitation in September in the low elevations have seen continued 90-day deficits in the upper elevations which supply the vast majority of runoff for downstream streamflows and fall reservoir inflows.
Taking a look at the Yakima Basin provides more evidence of these below normal streamflows. This graph of Yakima Basin total storage shows current year storage (blue line) has declined slightly throughout the month. Historically, storage should begin to increase late in the month (red line). A wetter pattern looks to be on the way in the coming weeks, so we are hopeful that inflows will increase through November.
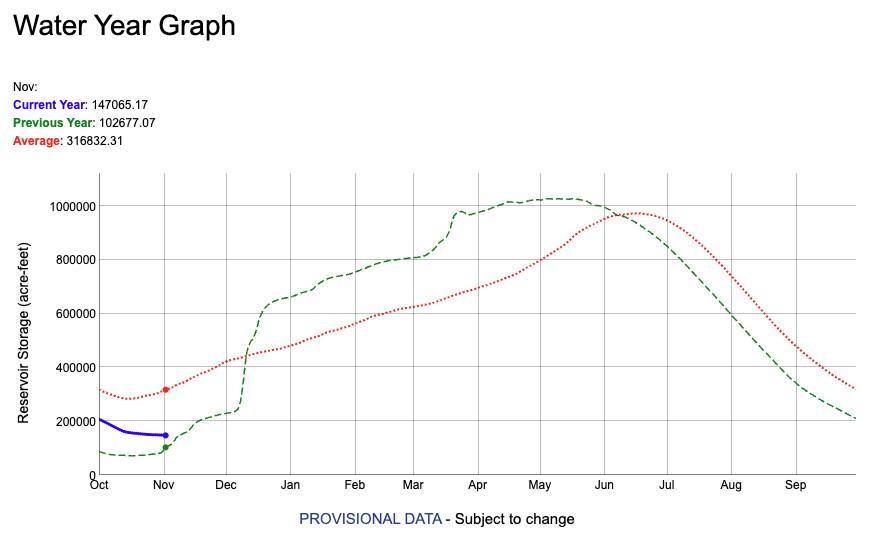 Yakima River Basin total reservoir storage through November 3, 2026. Data from the U.S. Bureau of Recreation. Note: A new water year has started. The 2026 water year, which just ended on September 30, 2026, is depicted here on the green dashed line. The dotted red line shows historical average reservoir storage. Current storage is depicted by the blue line. Storage volumes are noted in the legend in the upper left.
The U.S. Drought Monitor shows little change in drought conditions over the past month aside from some slight improvement in drought conditions in Yakima County thanks to well-timed September rains in the lower elevations. As of November 3, the total statewide area experiencing some level of drought conditions (D1-D4) remains at 61.45%. D3, Extreme Drought, continues in Okanogan and Spokane Counties.
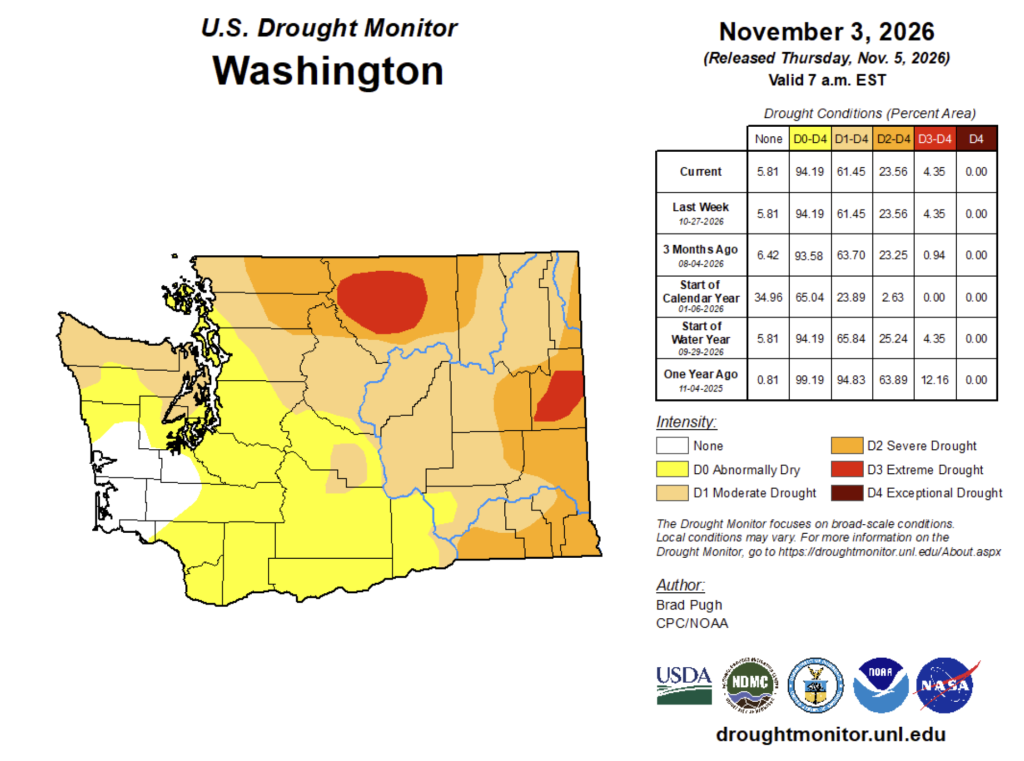 U.S. Drought Monitor for Washington. Data valid on November 3, 2026. The Table on the right shows what percentage of the state, by land area, is in each drought condition category currently and over the past year.