By Nick Bond
We trust that most everybody interested in the climate variability of Washington state is already aware that El Niño conditions are present in the tropical Pacific. At the very least, discussions of the prospects for the winter of 2023-24 during the last few months have generally included this element. In addition, El Niño tends to be accompanied by warmer than normal temperatures in the Pacific Northwest, and often, if not as consistently, suppressed precipitation totals. An important consequence of El Niño therefore is the tendency for a sub-par snowpack at the end of winter. Nevertheless, we have wondered whether the relationship between El Niño-Southern Oscillation (ENSO) and winter snowpack has varied over time, and thought it merited a look.
As is usually the case with these pieces, we have taken a simple as opposed to a comprehensive approach. We use the 1 April snow water equivalent (SWE) at Stampede Pass with an elevation of 3959 feet in the central Cascade Mountains as an index for the end-of-winter snowpack. Presumably it is representative of the moderately high elevations of WA state as a whole; we recognize that there are surely some years that are exceptions. Moreover, the east side of Stampede Pass is part of the watershed for the Yakima River, which is a primary source for irrigation in the Yakima Valley. Poor snowpacks in the central Cascades frequently result in curtailments for junior water rights holders in the Yakima Valley during the following summer. We specify the state of ENSO using the NINO3.4 averaged over the months of October through March. For present purposes, we have examined the relationship between this index for ENSO, and the 1 April SWE at Stampede Pass, for the years of 1950 through 2023, focusing on how the first half compares with the second half of this interval. Towards setting the stage, a time series of 1 April SWE at SMP for 1950 through 2023 is plotted in Figure 1. The highest value in this record is 85.8 inches in 1956 with the 80.4 inches in 1997 not far behind. The lowest value is a miserly 0.1 inch in 2015 when the snowpack statewide was the worst on record. We note that bad snow years also occurred in the early part of the record, with the 18.1 inches of 1963 being a low point. There is also an overall downward trend during the 74 years shown, as is typical for stations in the Pacific Northwest near Stampede Pass’s elevation, where modest increases in temperature can result in a greater proportion of precipitation falling as rain. The year-to-year variability in SWE has changed negligibly over the interval.
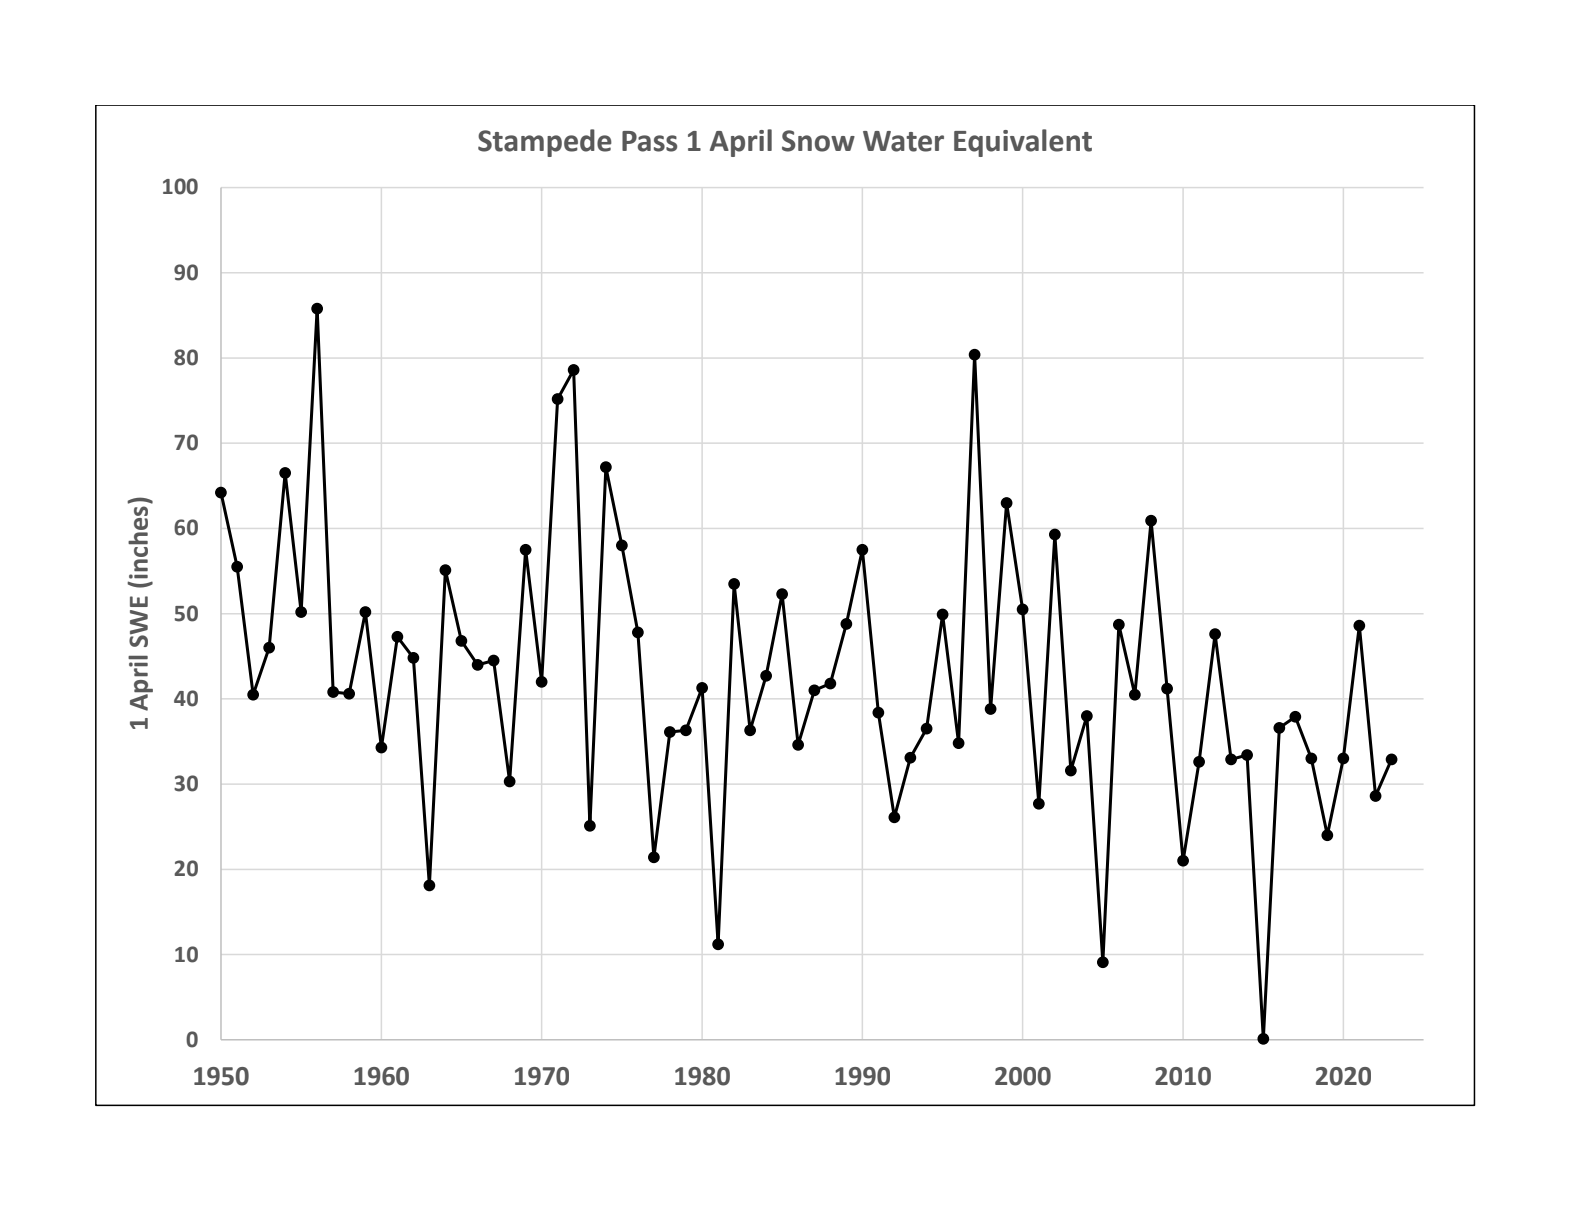 Figure 1: April 1 snow water equivalent (SWE) at Stampede Pass from 1950 through 2023 (data from NRCS).
Scatterplots of NINO3.4 versus 1 April SWE at SMP for the years of 1950 through 1986, and the years of 1987 through 2023 are shown in Figures 2 and 3, respectively. An obvious difference between these plots is a stronger relationship between NINO3.4 and SWE in the earlier as compared with the later set of years. In more quantitative terms, the best-fit linear slope in the SWE relative to NINO3.4 is about half as strongly negative during the first 37 years as the slope during the second half. In other words, at least for 1 April SWE at Stampede Pass, it appears that ENSO in recent decades has had less of an influence than it did in the past, with the very real possibility this is due to extenuating factors not considered here. We are struck by the nature of the scatter plot in Figure 3 and in particular how most of the recent winters have ended up with about 30 to 50 inches of SWE at Stampede Pass, irrespective of the state of ENSO. Apparently, negative values of NINO3.4 essentially prevent really terrible snowpacks, but by no means guarantee robust values. Similarly, positive values of NINO3.4 have not been accompanied by any snowpacks above the 30 to 50 inch SWE band. Moreover, the extremely poor snowpack years of 2005 and 2015 were when the NINO3.4 index barely reached 0.5, i.e., only weak El Niño territory by even generous standards. And the intense El Niño events of 1998 and 2016 included typical rather than unusually low SWE values for the 2nd part of the record.
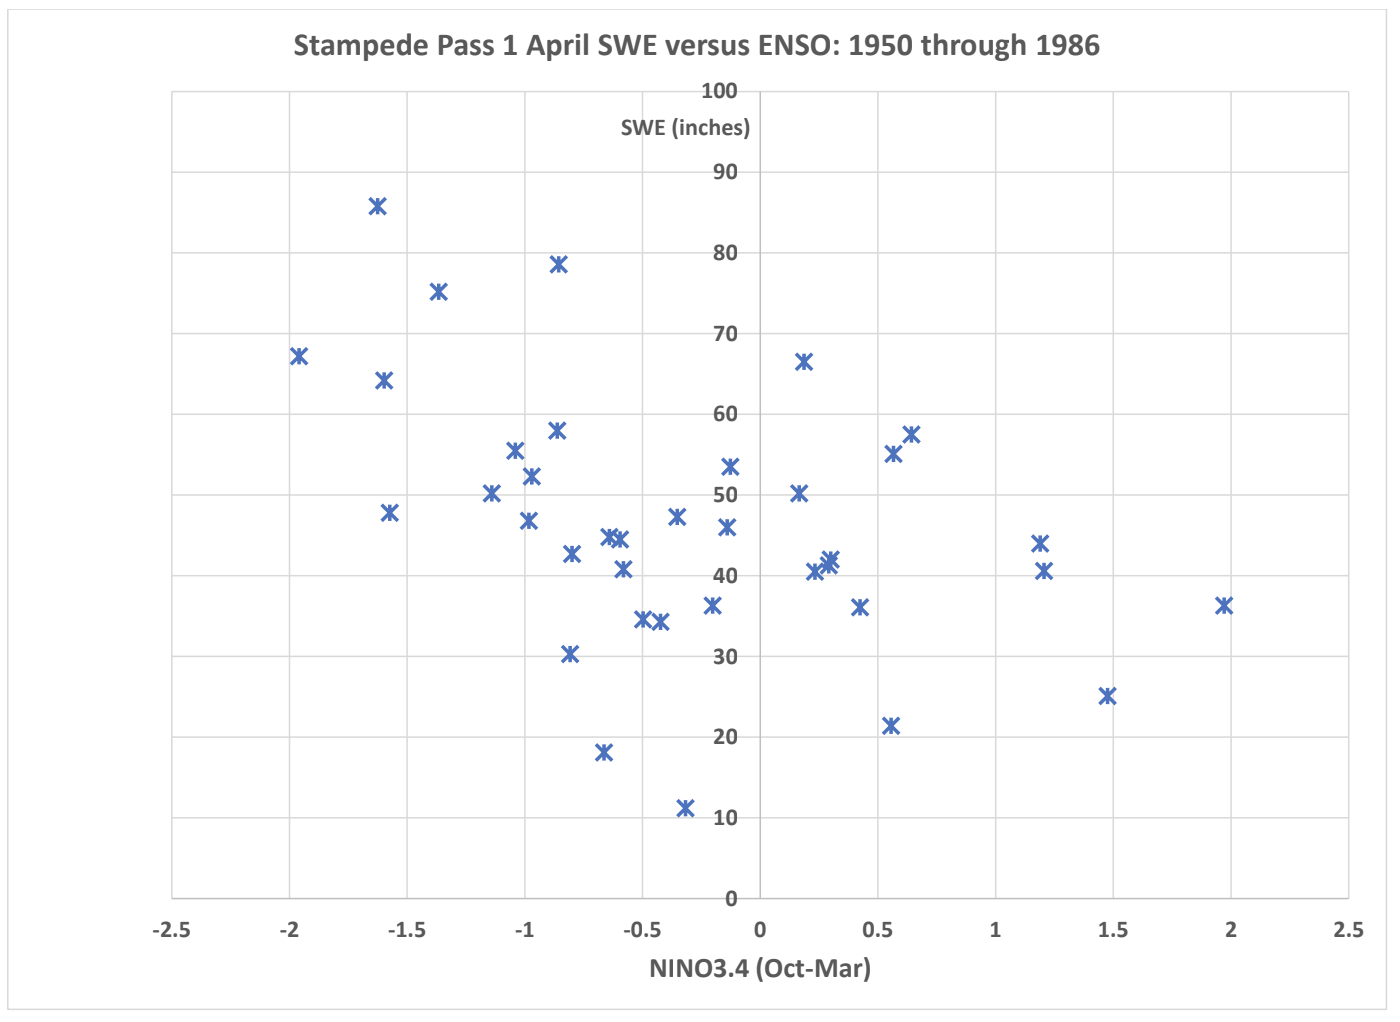 Figure 2: April 1 snow water equivalent (SWE) in inches at Stampede Pass (y-axis) vs. the October-March NINO3.4 index (x-axis) for 1950 through 1986. Positive NINO3.4 indices represent El Niño- like conditions: roughly between 0.5 and 1 are weak, 1 and 1.5 are moderate, and above 1.5 is strong. This scaling applies to the La Niña conditions as well, except those numbers are negative.
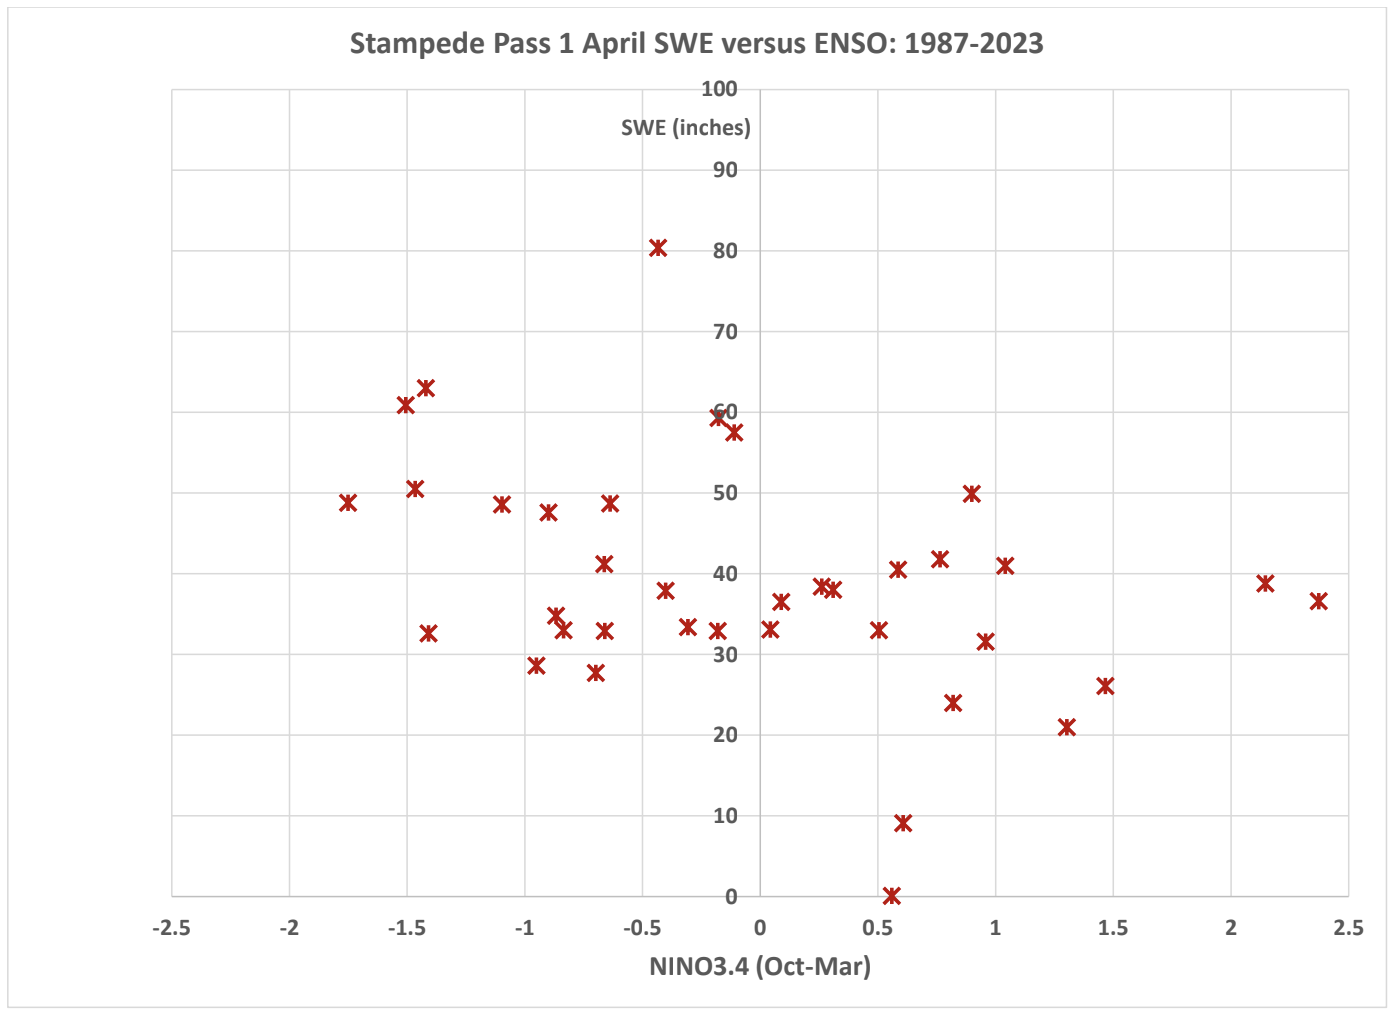 Figure 3: The same as Figure 2, except for 1987 to 2023.
We would like to be able to reconcile the seemingly weaker ENSO signal in recent years here, but doing so is no cinch and well beyond the scope of this piece. There are regional atmospheric circulation differences between the two sets of years. For example, the 500 hPa flow anomalies during the moderate La Niña (NINO3.4 < -1) winters of the first set of years were about twice as strong from the northwest in a composite sense compared with their counterparts for the second set of years (not shown). It makes sense that the former set of winters were snowier. But it does not account for why the response in terms of regional weather/ circulation patterns has been weaker lately. We can blame the internal variability of the circulation over the North Pacific and western North America, which certainly modulates the remote connections to ENSO, but that feels more like an excuse than an explanation.