By Adelina Rodriguez
Soil moisture is becoming an increasingly important parameter in drought indication. However, collecting soil moisture data on a large scale is not easy, due to the multitude of soil properties and environmental factors affecting water accumulation and drainage in soils. The diverse landscapes and soil types here in Washington present an interesting challenge when measuring soil moisture, conducting data analysis, and reaching accurate conclusions. Additionally, there are numerous soil moisture products that collect data and analyze current conditions differently. Sometimes contradictory information from these products can lead to false interpretations of moisture levels and drought across the state. This summer, I investigated the performances of two gridded, satellite-derived soil moisture products from NASA (called GRACE1 and SMAP2) in Washington.
Previous studies have analyzed the performances of different soil moisture products in other parts of the world, although there were none that compared these two products specifically and none conducted within the state of Washington. I chose these two products due to their relatively high spatial resolution across the CONUS (14 km for GRACE and 9 km for SMAP), the accessibility of their large data sets, and their varying instruments used in data retrievals. More specifically, the GRACE satellites use accelerometers to measure gravitational anomalies associated with fluctuations in soil moisture content. The SMAP satellite uses radar and radiometers to sense microwaves and measure brightness levels. Raw data from both GRACE and SMAP are assimilated into land surface models developed by scientists at NASA that take into account environmental parameters and forcings, which is what allows for the relatively high resolution of the soil moisture data.
In order to analyze the performance of satellite products, I compared the satellite data to in situ data available at select weather stations in Washington. Figure 1 shows the locations in Washington in which soil moisture data were considered. I focused on four case studies, including spring 2021 and 2022 (April to June), summer 2018 (July to September), and fall 2016 (September to November). I also explored how these products represented contrasting landscapes, including forested regions, croplands, grasslands, and snowy areas. A large chunk of my summer was spent pre-processing the data sets I compiled from various sources. After meticulous efforts and plenty of human errors, I was able to work with the data on MATLAB. I used scripts to merge data into 3D arrays and plot dozens of time series graphs. I also created box and whisker plots to display correlation results. Along the way, I ran into several significant obstacles. Each product has different units and depths of measurements and a different sequence of data acquisition, so I was unable to use the Root Mean Squared Error metric and to conduct a Triple Collocation test. Due to the huge datasets that would be required for an analysis over multiple years, I had to shorten my analyses into a couple of case studies each only 3 months long. Still, my investigation yielded interesting results.
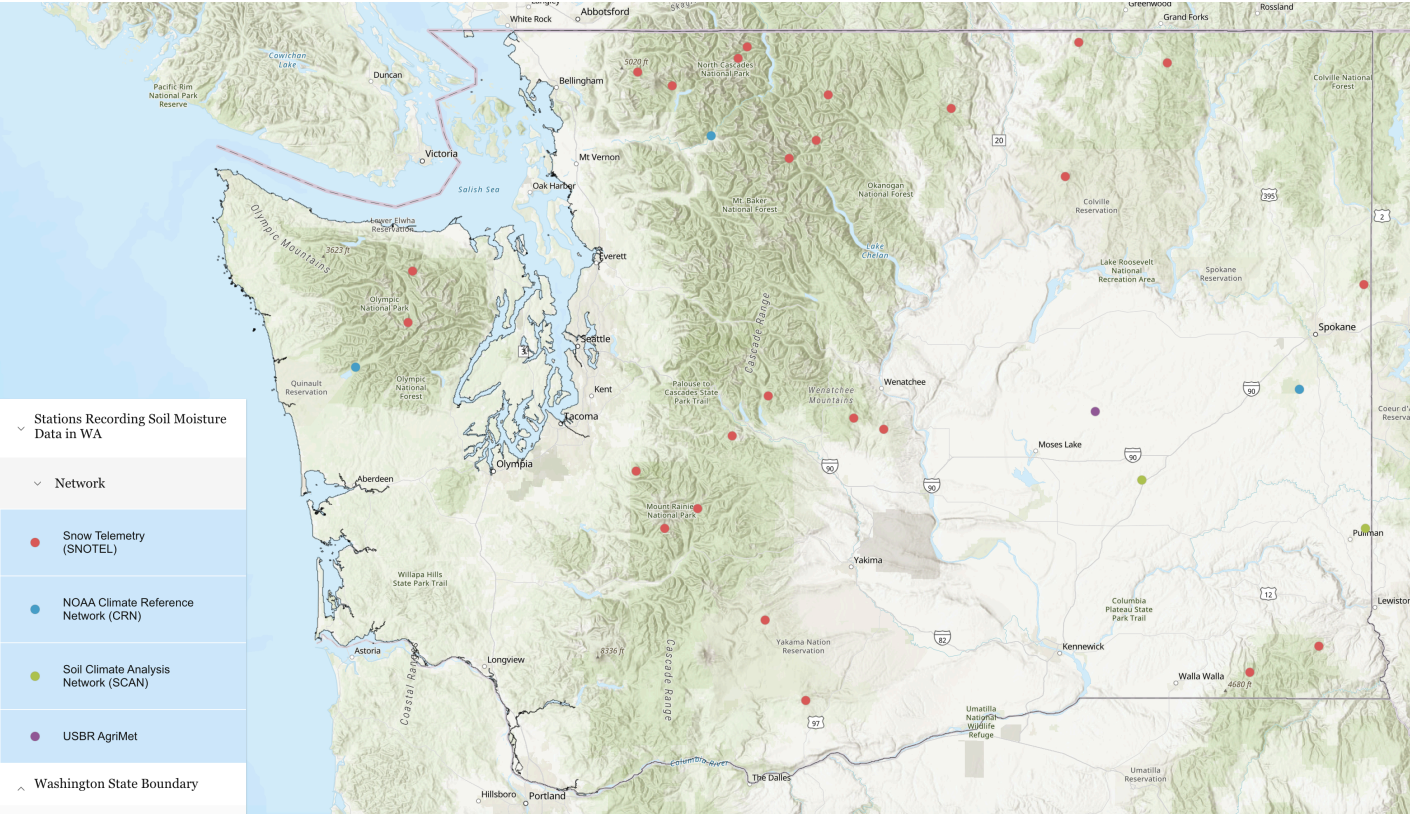 Figure 1: A map of current soil moisture in situ monitoring sites in Washington, color-coded by observational network (Adelina Rodriguez).
GRACE and SMAP provide contrasting data at the same in situ sites, and they perform with varying levels of accuracy for distinct land types across the state. Figure 2 shows an example of a poor SMAP performance during the spring snowmelt season, but excellent performance during a dry summer at the same location. Snow on the ground interferes with the radiative signals which SMAP relies upon, leading to inaccurate soil moisture estimates. The SMAP product represents soil moisture observations in croplands and grasslands best throughout the year, especially in summer. GRACE, however, performed poorly in most areas during all seasons (Figure 3). This is likely due to the fundamental measurements of GRACE related to large-scale distributions of soil moisture while the station observations are sensitive to unresolvable local effects.
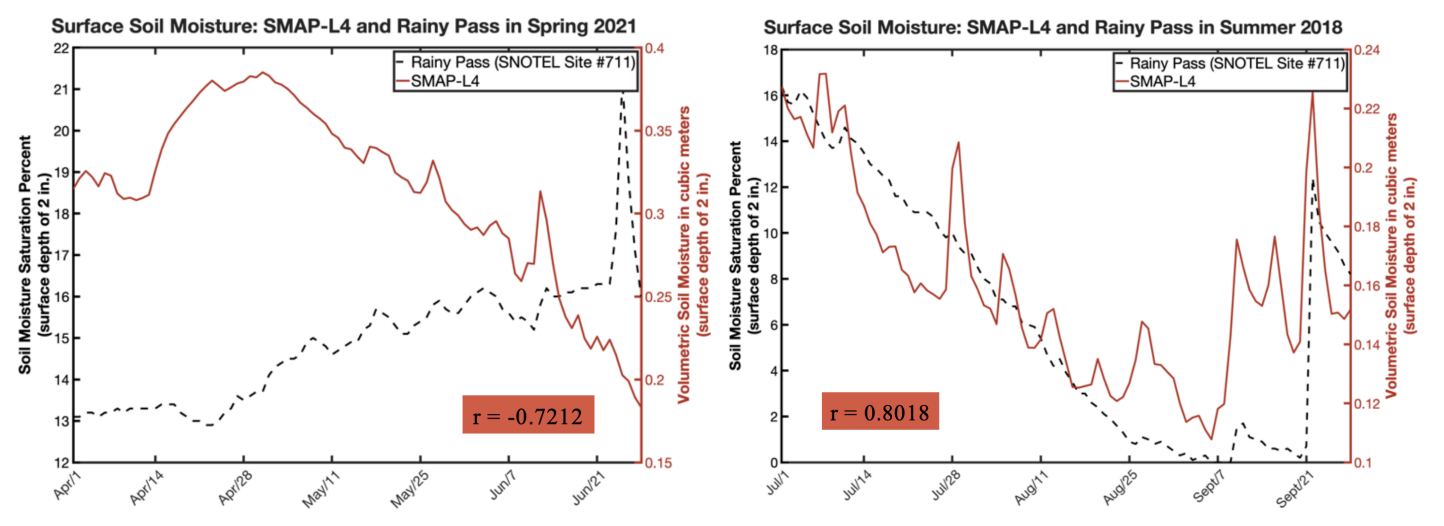 Figure 2: Soil moisture saturation percent at Rainy Pass during spring 2021 (left) and summer 2018 (right) compared to the SMAP volumetric soil moisture (m3) at the grid cell containing Rainy Pass during those two time periods.
Despite discrepancies in the datasets and the limited periods of analysis, my results (Figure 3) show that SMAP is generally more useful than GRACE when using satellite products for soil moisture monitoring in Washington. The main takeaway from my project is that drought coordinators, agricultural interests, and public officials should take land type and seasonality into careful consideration and gather soil moisture information from multiple sources. There is still plenty of work to be done on making soil moisture monitoring more cohesive in Washington state.
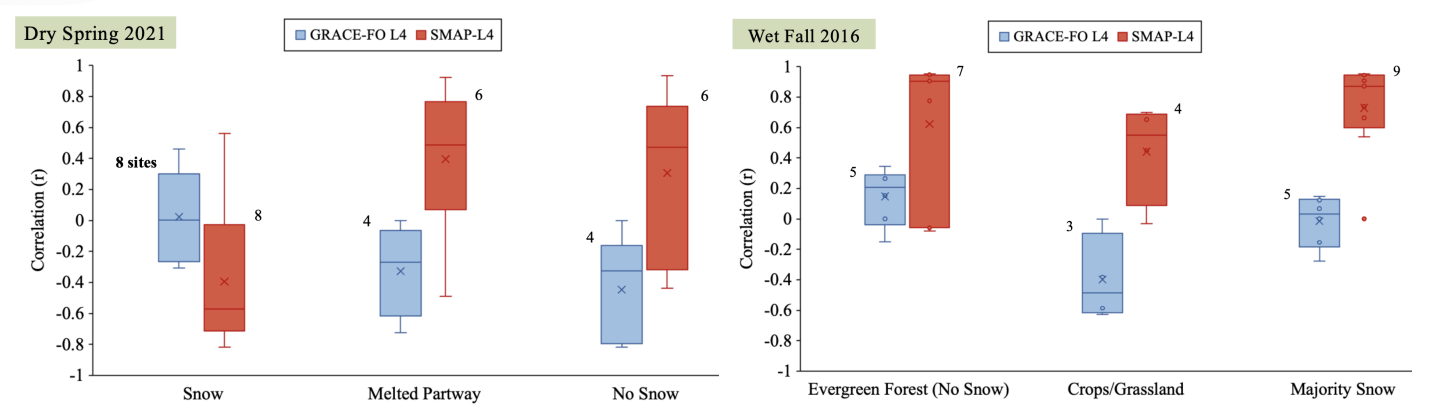 Figure 3: Pearson correlations between satellite-derived products and in situ observations.Correlations are between daily variations in in situ data and respective satellite-derived data retrieved at the same spatial coordinates, during a dry spring (left) and a wet fall (right). The number of in situ data sites used in the analysis is indicated above each box and whisker plot.
Data
1: GRACE-FO L4 Data: Matthew Rodell and Hiroko Kato Beaudoing, NASA/GSFC/HSL. (2021). Groundwater and soil moisture conditions from grace and grace-fo data assimilation l4 7-days 0. 125 x 0. 125 degree u. S. Version 4. 0. NASA Goddard Earth Sciences Data and Information Services Center. doi: 10.5067/UH653SEZR9VQ. [August 2023].
2: SMAP-L4 Data: Reichle, R., G. De Lannoy, R. D. Koster, W. T. Crow, and J. S. Kimball. 2017. SMAP L4 9 km EASE- Grid Surface and Root Zone Soil Moisture Geophysical Data, Version 3. Boulder, Colorado USA. NASA National Snow and Ice Data Center Distributed Active Archive Center. doi: 10.5067/B59DT1D5UMB4. [August 2023].