By Nick Bond
At the risk of belaboring the obvious, we would first like to point out that we have been experiencing unusually dry weather in Washington state. A map of the precipitation during May through July 2023 expressed as a percent of normal. (Figure 1) shows that aside from a single wet bullseye in Ferry County, precipitation totals for the 3-month period have been considerably below normal. At least one-half of the state has received less than 50% of normal precipitation and there are a few spots in the below 25% category. Not surprisingly, one result is that state streamflows are mostly on the low side, as illustrated above in the Streamflow and Drought Summary. But how long has this been the case?
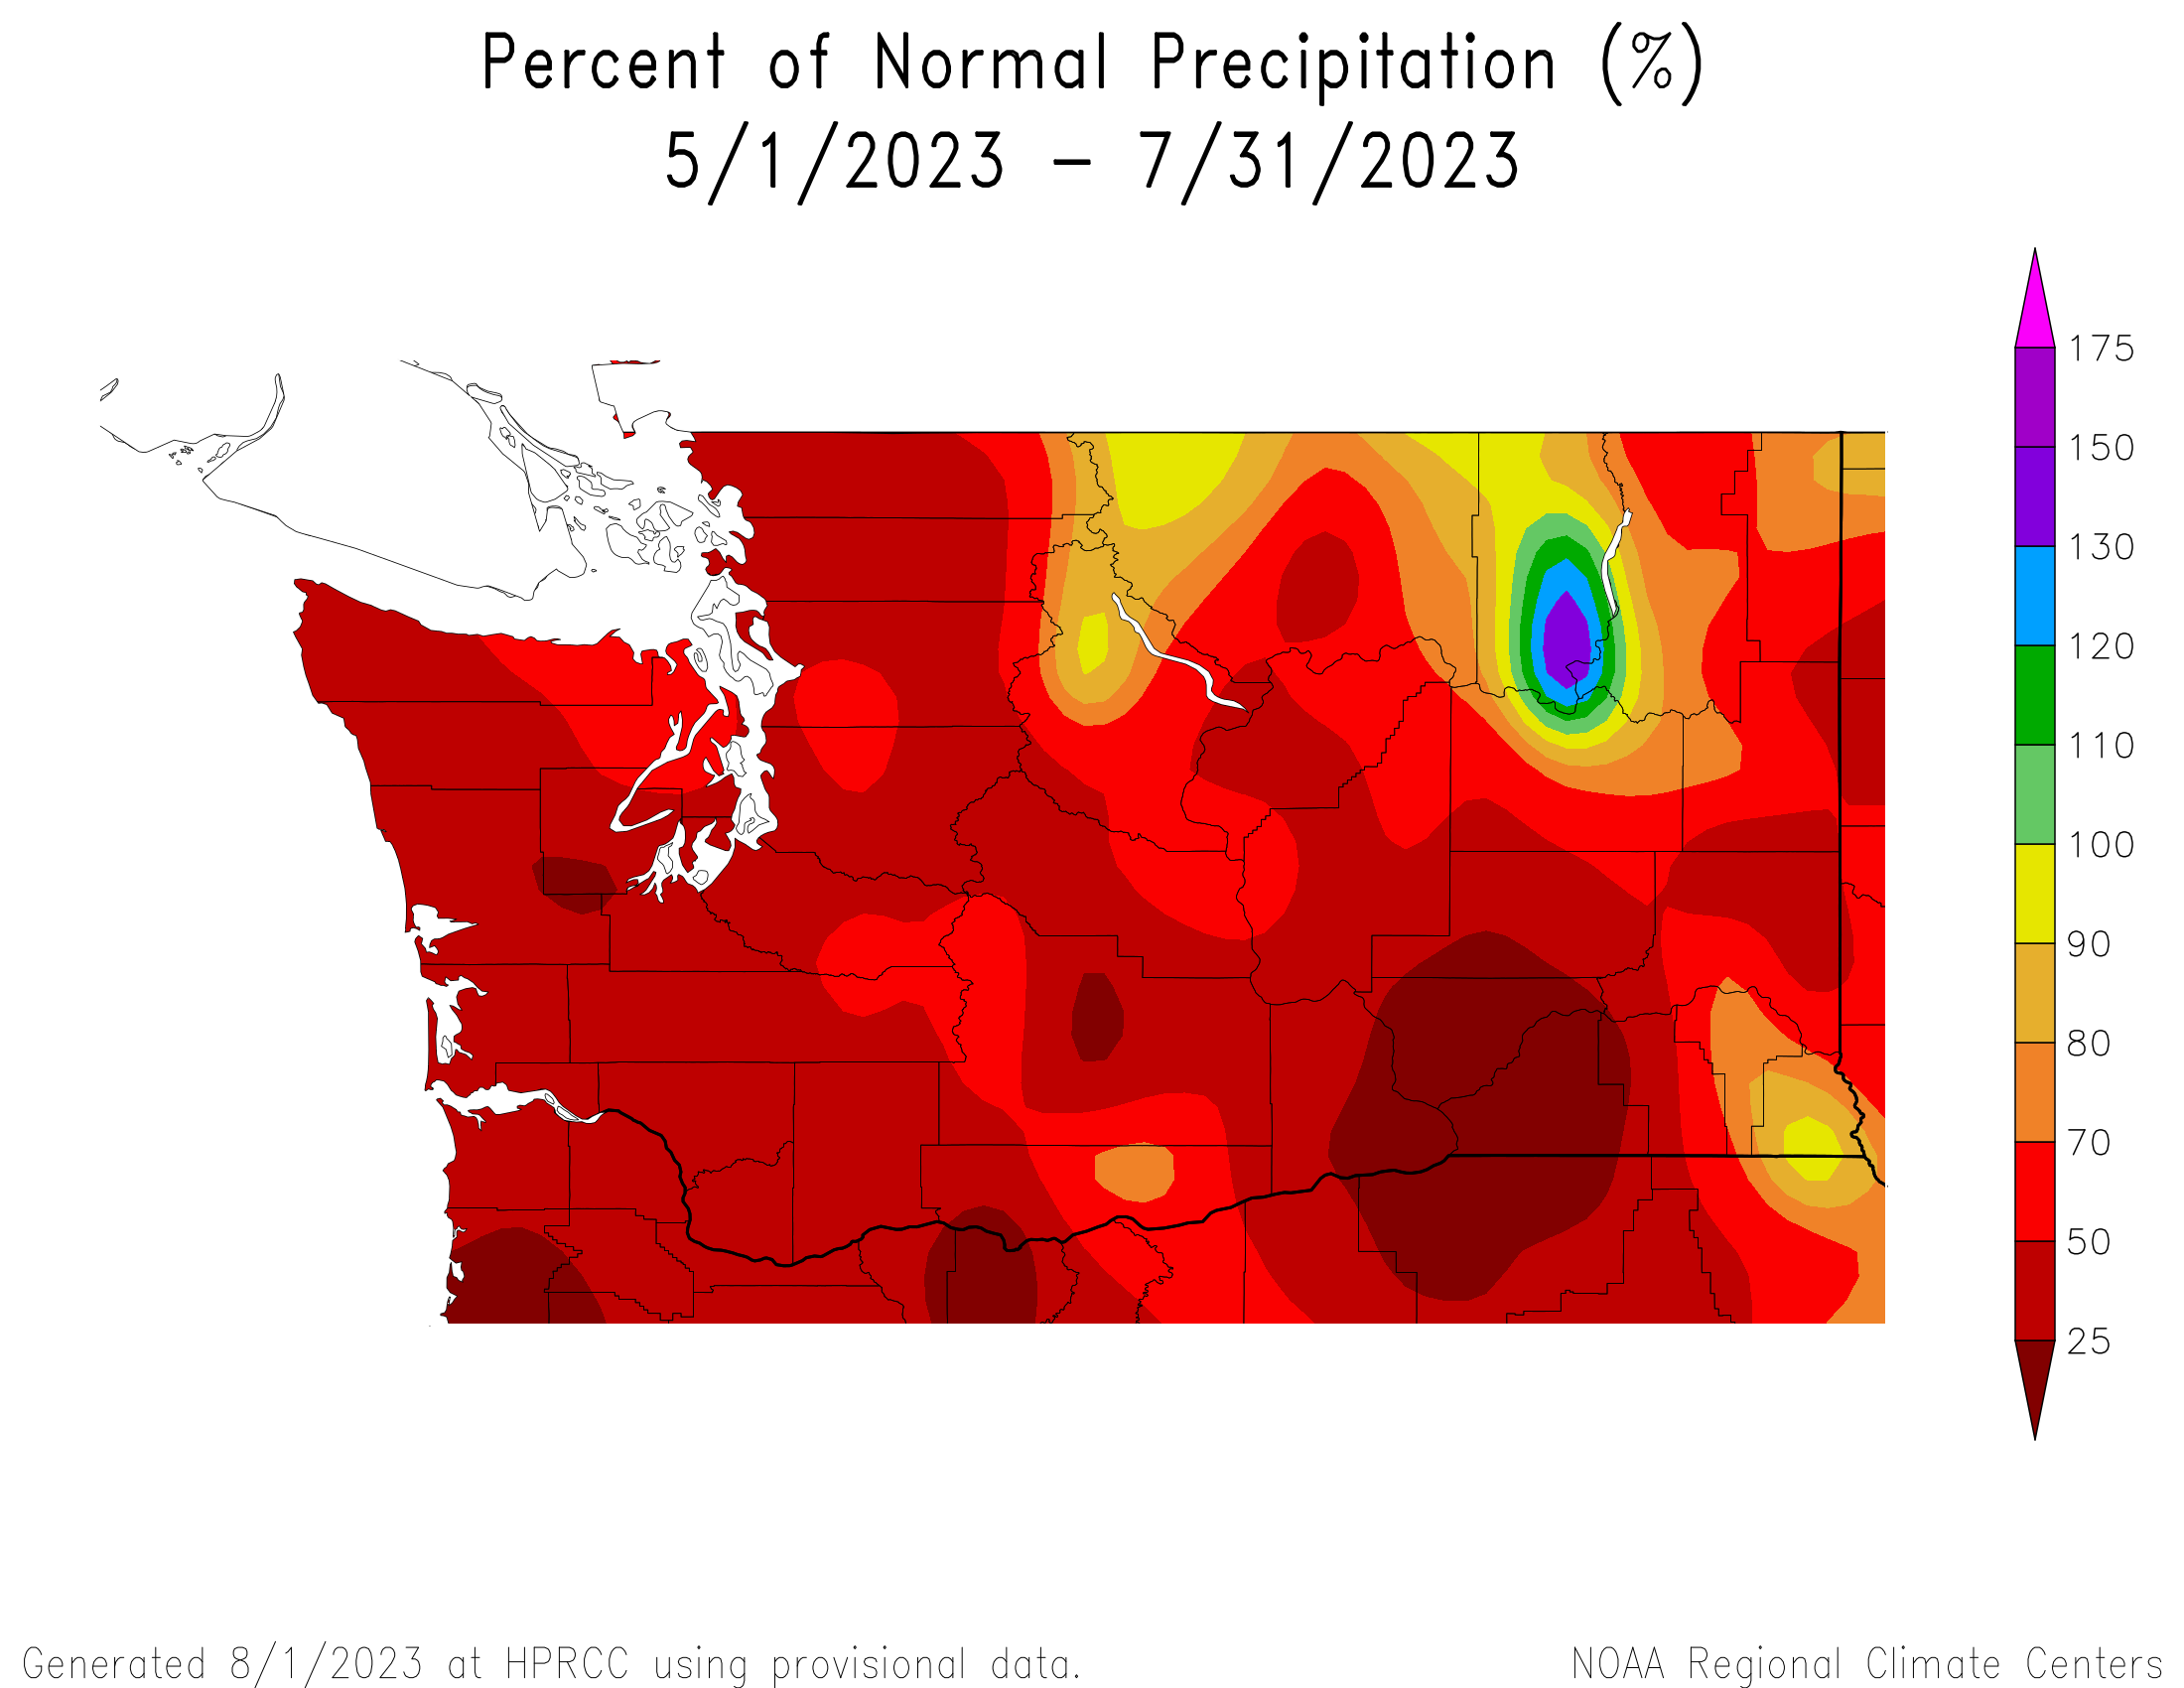 Figure 1: May-July 2023 percent of normal (1991-2020 baseline) precipitation across Washington (HPRCC).
We address that question by presenting a time series of the duration hydrograph of 7-day average runoff for WA state back to 1 October 2021, courtesy of the USGS (Figure 2). This metric for the streamflow consists of the integral (sum) of the estimated flows (based on stream gauges) out of the watershed basins over 7 days divided by the of area of the state. The result is equivalent to the amount of precipitation averaged across the state that would be needed to supply the water flowing out of its basins. Of course there is a seasonal cycle to the runoff, as depicted by the green band in Figure 2, with a minimum near the end of September after our dry summers. There are two high runoff peaks, with the first occurring in late November/early December with our fall rains, and a later peak in late May/early June due to snowmelt. Figure 2 shows that the latter peak occurred relatively early in 2023, due to our extremely warm May, which was tied for the warmest on record going back to 1895. But in late May, the runoff nosedived to levels near the 5th percentile for the time of year. It continued through July 2023, with runoffs at or below the 5th percentile level.
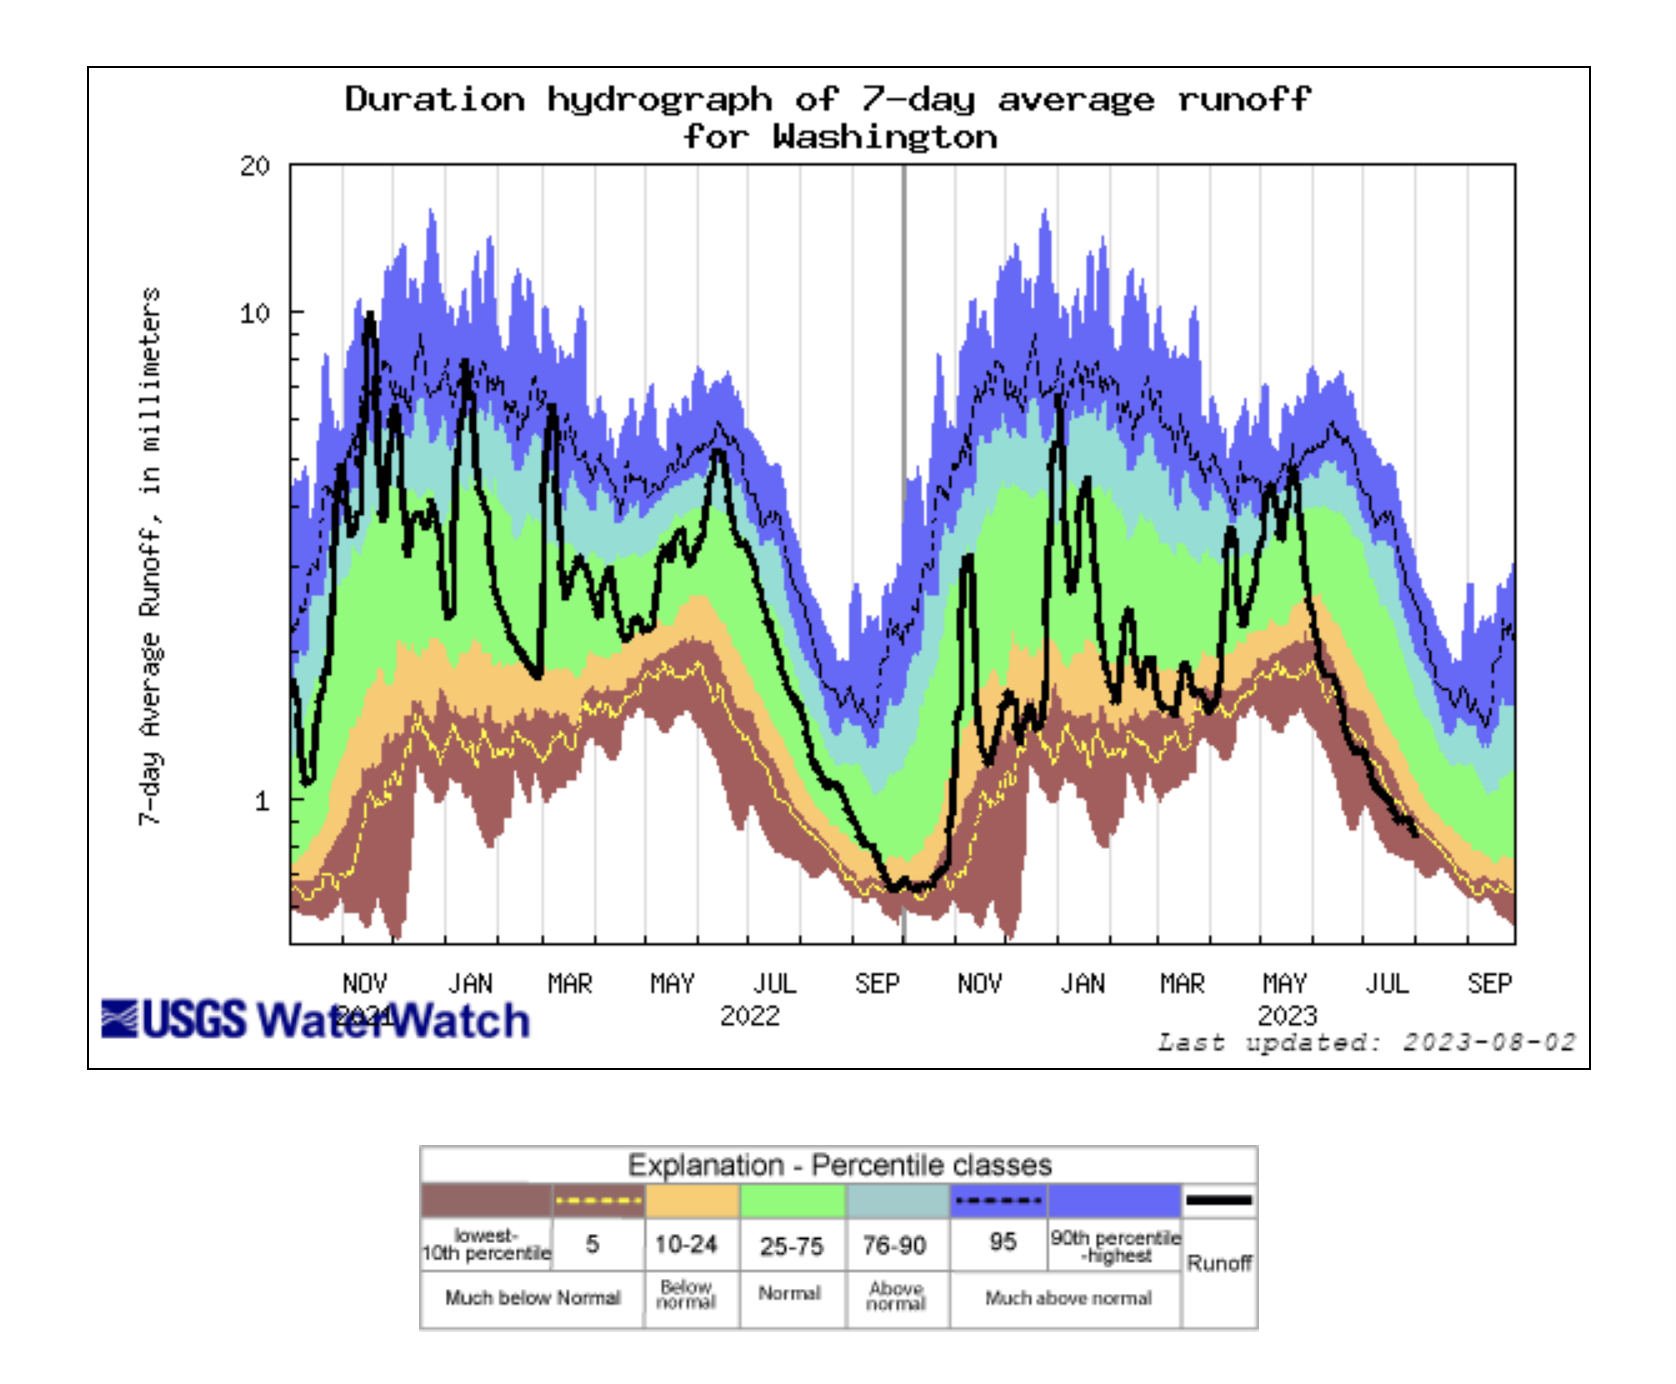 Figure 2: 7-day average runoff averaged over Washington for October 2021 through July 2023 (USGS).
We now consider previous temporal variations in runoff. The effects of the prolonged summer of 2022 are obvious, with very low runoff values persisting well into October 2022 after the usual increase in flows. In retrospect, we were fortunate to have a wet spring and early summer in 2022; presumably stream conditions in September and October 2022 would have been even worse if the dry season of 2022 had not gotten such a late start. Looking further back into the past, there was record runoff for the time of year that occurred in November 2021. This peak reflects in large part the extreme flows that occurred in the northwest part of WA state resulting in severe flooding, especially in the watershed of the Nooksack River in Whatcom County. We note here that major swings in the runoff during the wet time of year from late fall through winter are common, with periods of heavy precipitation interspersed with intervals of drier and/or colder weather yielding temporarily lower streamflows. In other words, 20% of the time the runoff should be in either the much above normal or much below normal categories.
The climate models used for future projections are indicating, as a group, a tendency for wetter winters and drier summers, with substantial differences in the trends amongst the models. Moreover, our region will continue to experience significant interannual and multiyear fluctuations in precipitation (and temperature). But given the relatively dry summers of the past couple of decades in an overall sense – possibly but by no means certainly a signature of climate change – will there be increasing seasonality in the runoff in WA state? We will be keeping track.