By Nick Bond
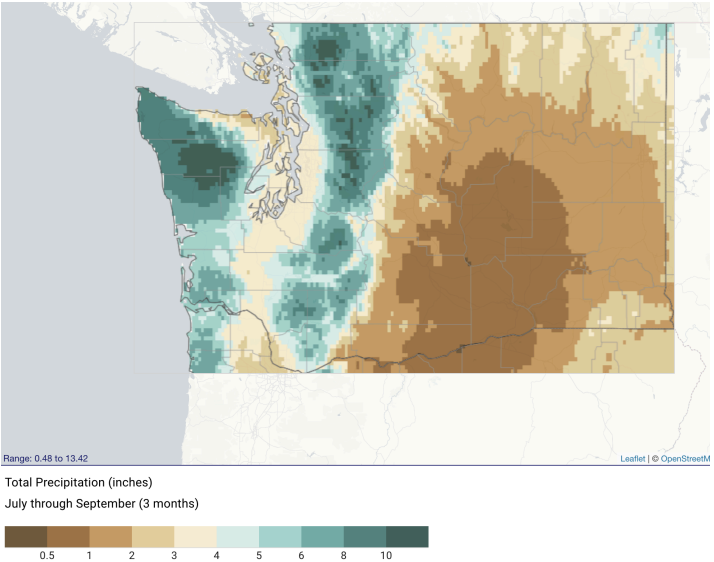 Figure 1: The 1991-2020 average of total July-September precipitation, using gridded NCEI data (NCEI).
Readers of this newsletter know that the Columbia Basin of Washington state is a dry region due to the shadowing of precipitation by the Cascade Mountains. Perhaps less appreciated is that this effect is actually a bit more pronounced in summer than in winter. For example, the “Central Basin” climate division (WA #8) averages a little less than 20% of the precipitation that occurs in the “Puget Sound Lowlands” climate division (WA #3) in mid to late summer (July-August-September; JAS) versus about 24% in winter (December-January- February). An illustration of the spatial pattern in mean precipitation for the months of July- September is shown in Figure 1. A few spots in the Columbia Basin check in with totals dipping down to about 0.50” for the three-month season. It is no surprise that it is dry in that part of Washington state but how might that be changing over time? The present piece addresses that question in a follow-up to last month’s edition on the trend in potential evapotranspiration (pET) through consideration of a climate metric known as the aridity index.
The climate community has used different formulations for the aridity index (AI). An early version proposed by Thornwaite was based on the water deficiency – the pET minus the precipitation – normalized by the pET. This index reflects the percentage of water that would have to be supplied to maintain vegetation not stressed by lack of water. In more common use in modern times is a form from the United Nations Environment Programme (UNEP) defined as AI = Precipitation/pET where both variables are long- term (often annual) means. Locations with an AI between 0.05 and 0.20 are classified as “arid”, with an AI of less than 0.05 classified as “hyperarid”. Here we examine time series of AI for the season of July through September, again as in last month’s piece using data from the AgriMet stations of Odessa, LeGrow and Lind, WA. Which of these categories do you expect applies to these stations?
You can see for yourself in the seasonal mean time series of AI for the years of 1987 through 2022 plotted in Figure 2. Over that interval, an overall decrease in AI has occurred for all three stations. During the early 1990s the AI reached the arid category, but since roughly the turn of the century during most years all three stations were in the hyperarid category, with only a few exceptions. Particularly dry years occurred in 2018 and 2020 when the AI was 0.01 and lower. The variability in the AI is largely driven by the precipitation term; seasonal totals range from less than 0.1 to greater than 2 inches at the three locations. By way of comparison, the ratio of the lowest to highest seasonal mean pETs are 0.55, 0.76 and 0.64 at Odessa, LeGrow and Lind, respectively. The higher ratio – and lower year-to-year variability in general – at LeGrow probably reflects the impacts of local irrigation through its tendency to increase the relative humidity. Certainly LeGrow has both a lower mean value of pET, and a lack of especially high pET years, compared to the other two locations. The standard deviation in seasonal total precipitation at LeGrow is similar to that at Odessa and Lind during the years of 1987 through 2022. Overall, the JAS AI at each of the 3 stations varies closely together from year-to-year.
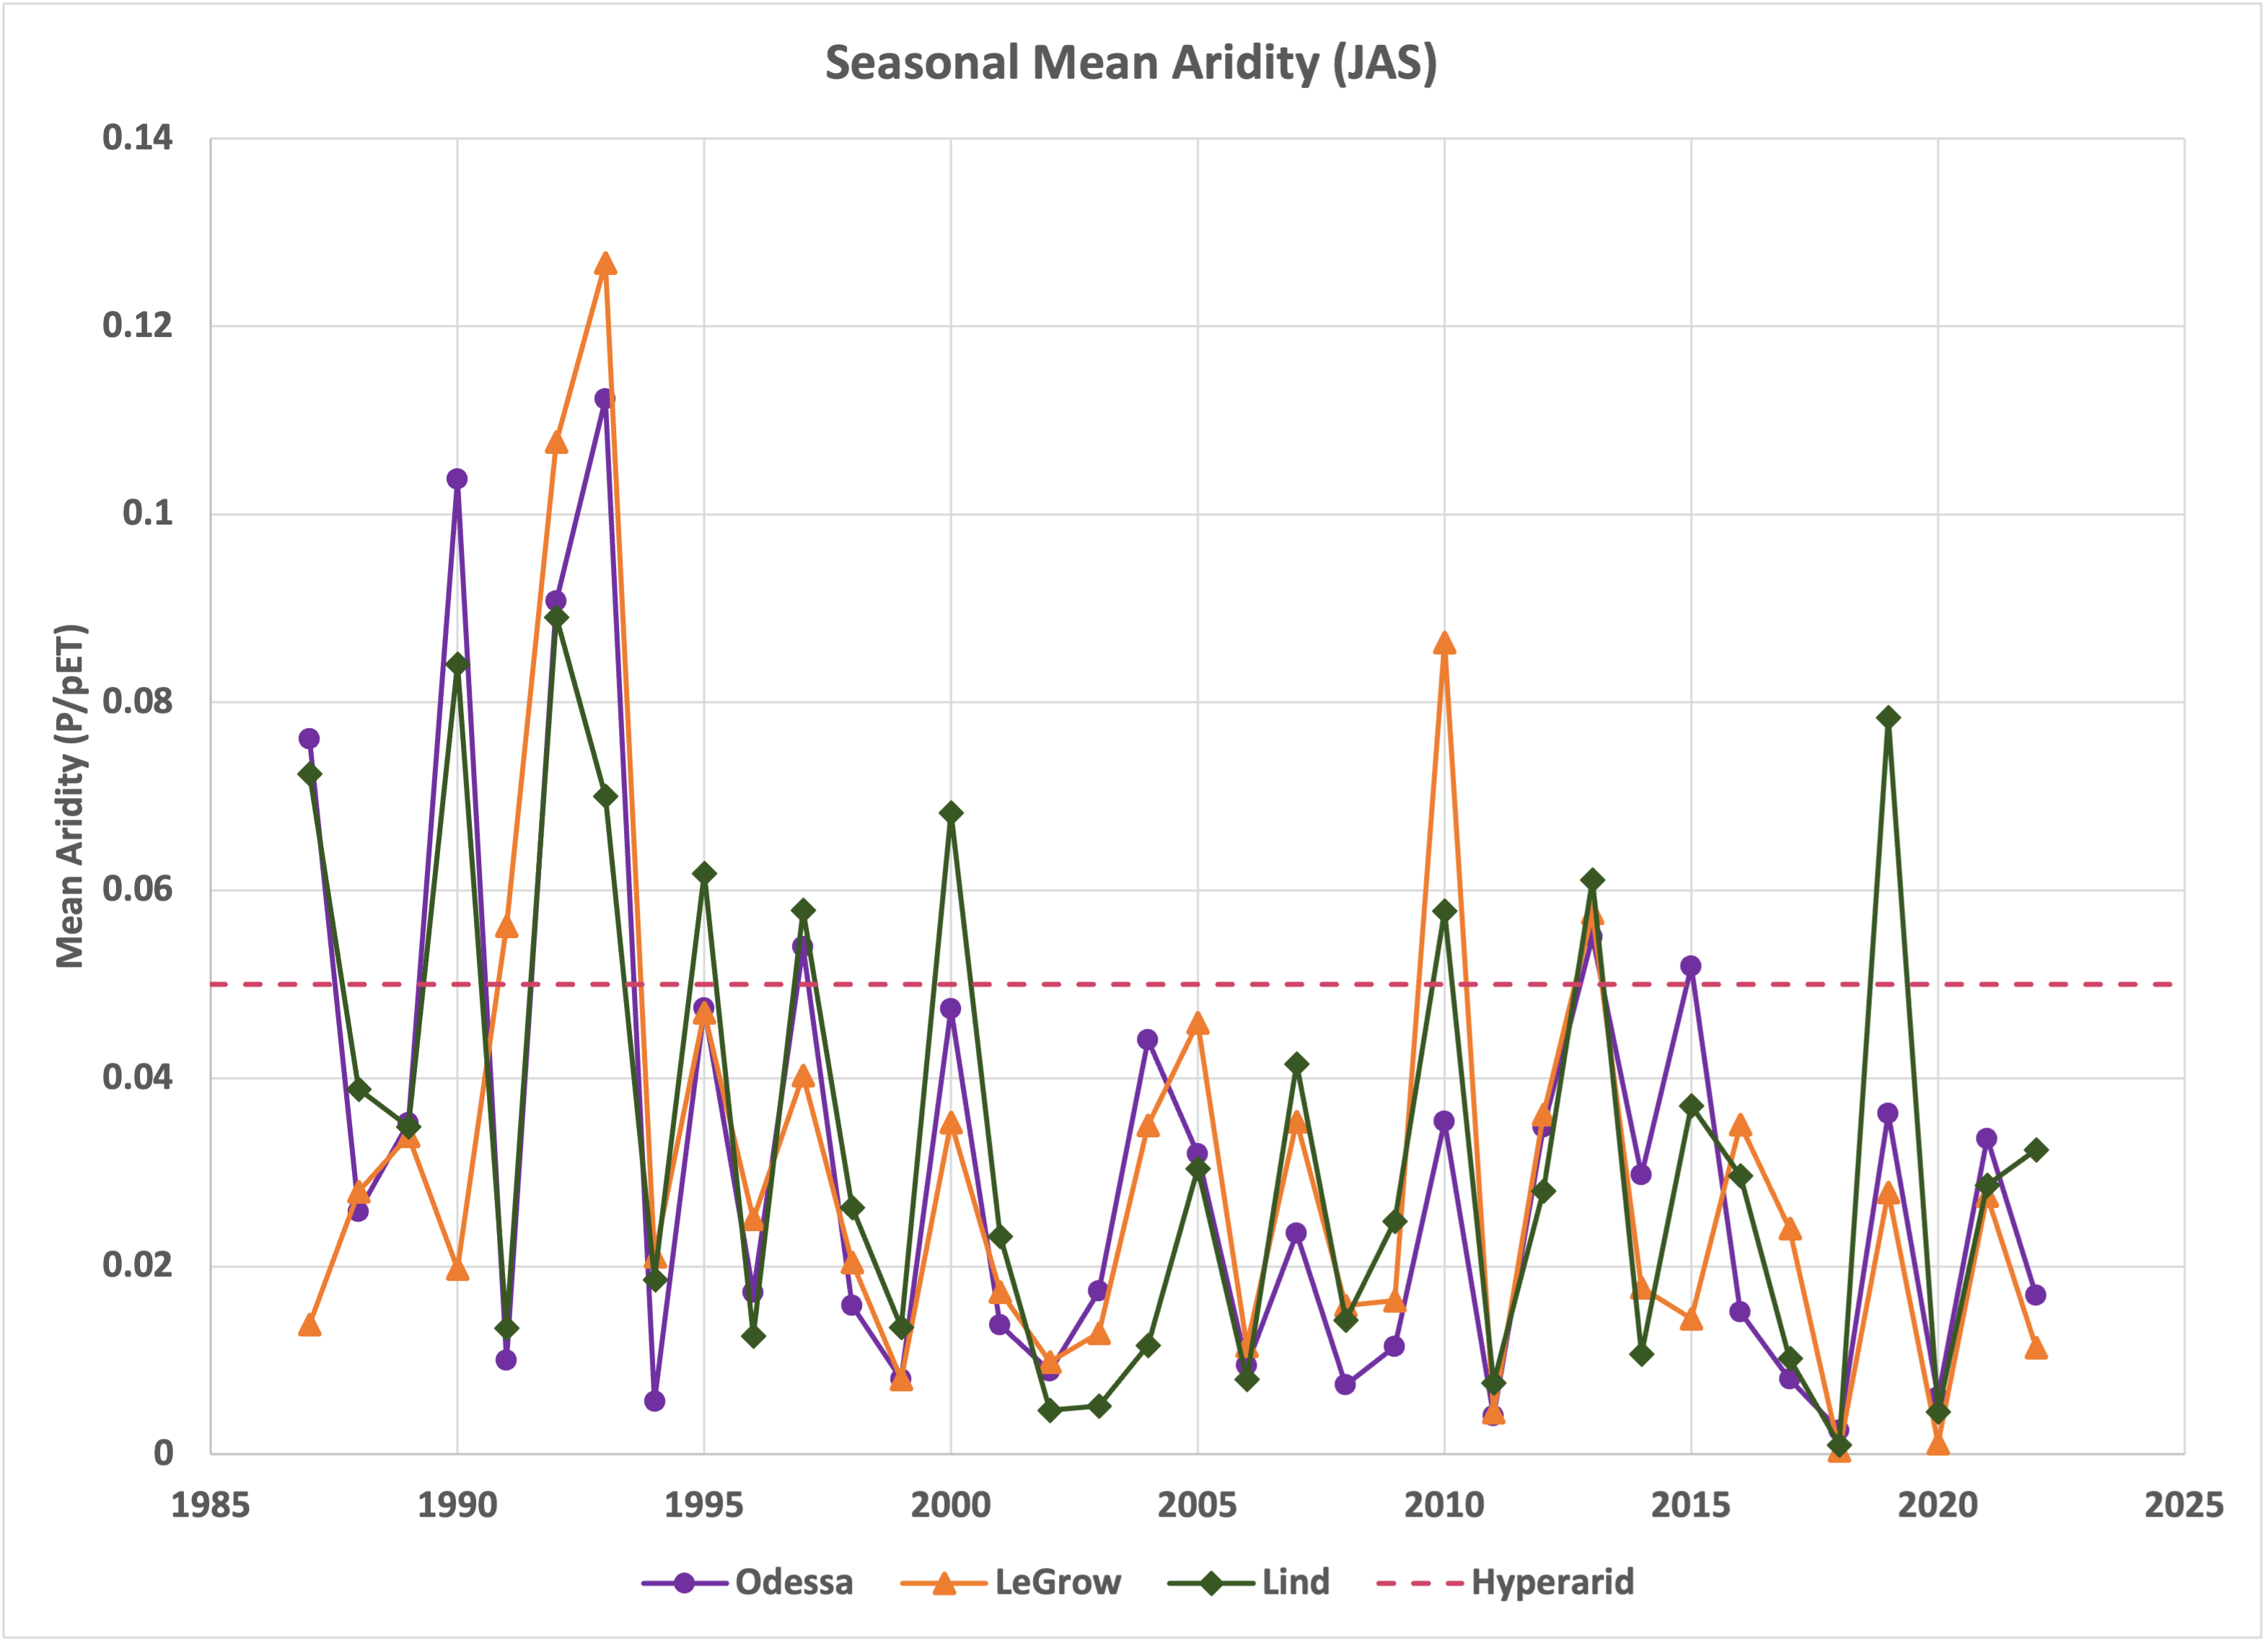 Figure 2: The July-September Aridity Index calculated from 1987 though 2022 for three stations in the AgriMet Network: Odessa (orange), LeGrow (purple), and Lind (green). The “hyperarid” threshold of 0.05 is marked by the dashed, pink line.
Another way of looking at the data is from a water deficiency perspective. Over the past 36 years, the linear best-fit trends to pET-P time series for July through September indicate declines of about 8 to 9 inches at Odessa and Lind and a decline of about one-third that at LeGrow. We are not experts on what that means for agriculture, and the terrestrial ecosystems of the Columbia Basin, but we expect it’s something.