By Nick Bond
As the readers of this newsletter are well aware, and for that matter everyone that was paying any kind of attention, the wet season last fall got a late start. Moreover, almost all of Washington state has received less precipitation than normal since the beginning of the calendar year, with the exception being a small region in the central portion of the state near the Columbia River. This was not anticipated given the presence of La Nina, which is usually – but importantly, not always –associated with relatively wet winters, especially on the west side of the Cascade Mountain crest.
But it is what it is, and going into spring 2023, the question is whether there are liable to be water shortages during the upcoming dry summer season. On the other hand, the winter has also been on the cool side, resulting in a higher proportion of snow versus rain in the mountains than otherwise. An important consequence is that despite the reduced precipitation totals, our snowpack is in decent if not great shape, as reviewed above. From a summer water supply perspective we would like to point out that there is an additional factor, namely soil moisture conditions.
A map of soil moisture conditions for the Pacific Northwest for 30 March 2023 is shown in Figure 1. This analysis is from NASA’s Short-term Prediction and Transition Center – Land Information System (SPoRT-LIS) and represents moisture contents in terms of percentiles over the 0-100 cm layer. There are patches of particularly low soil moisture right along the Pacific coast, in the vicinity of Puget Sound (especially the south part) and a north-south oriented strip along the eastern flank of the Cascades from the upper Yakima Valley into the Okanogan. Relatively dry soils are also present across much of the Palouse in the southeastern portion of the state, with potential implications for the wheat grown there, which is typically not irrigated. We note that there are a variety of real-time soil moisture analyses available, and there can be noticeable differences between them, but those distinctions are not the focus of the present piece. We also will not comment on the contributions of the extended summer of 2022 versus more recent lack of precipitation to the distribution of soil moisture in Figure 1, though it is likely that both factors are at play.
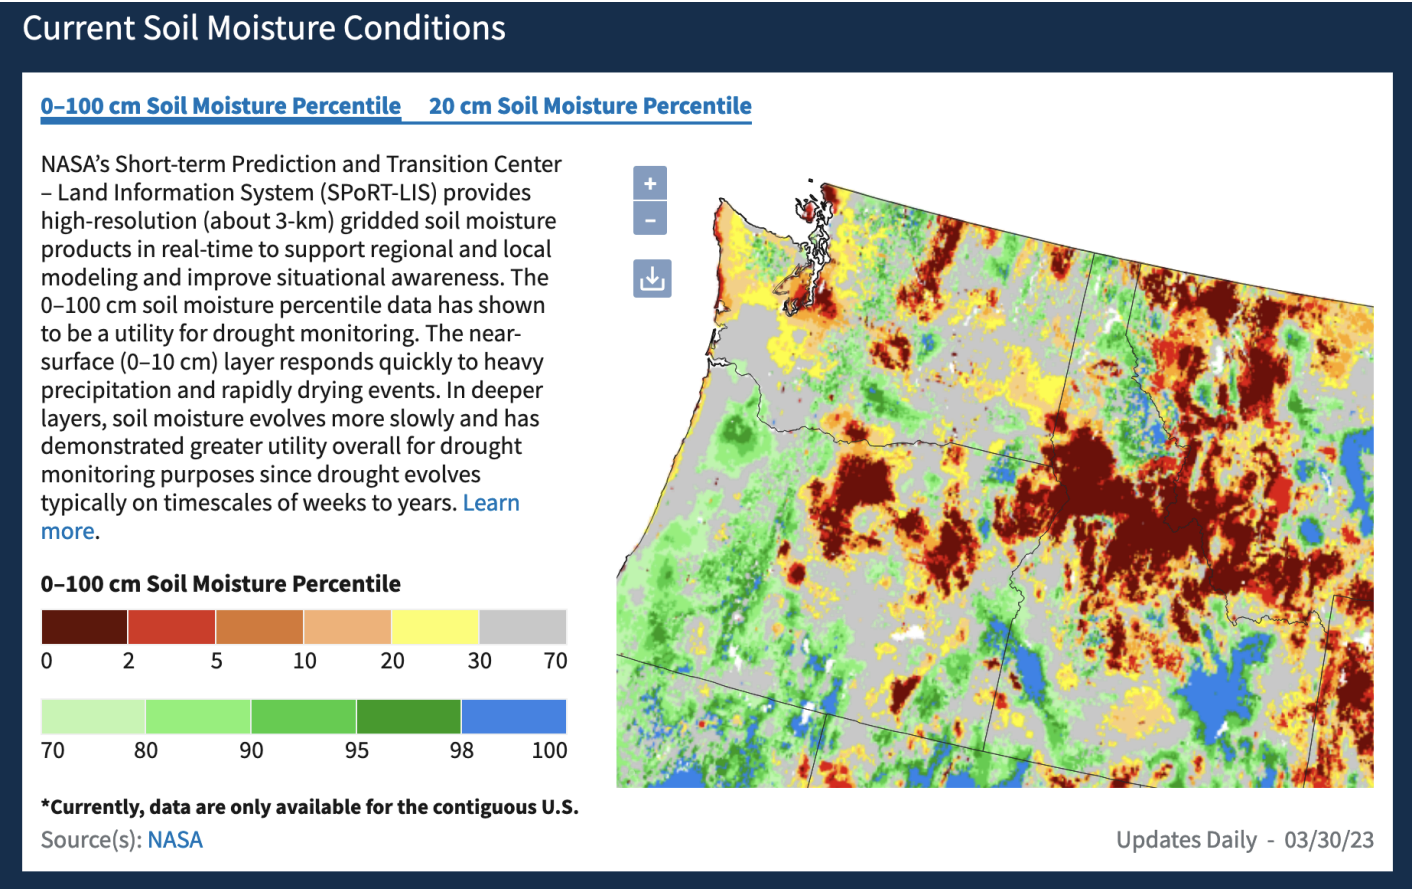 Figure 1: Soil moisture percentiles as of March 30, 2023 for the PNW from NASA’s SPoRT-LIS and hosted on the NIDIS website.
Instead we simply wish to point out that the lack of soil moisture in parts of the state may serve to delay and reduce the runoff from the snowpack. Relatively dry soil will wick up that much more melt water than usual as it moves from the surface down to the water table, resulting in lower streamflows. The effects of soil moisture are included in the Ensemble Prediction System (ESP) used by the Northwest River Forecast Center to make water supply forecasts, and are liable to be a significant if not necessarily dominant factor in their forecasts of reduced summer flows for some of our streams. The current natural April- September water supply forecast (Figure 2) shows below normal streamflows in Okanogan and Spokane counties (between 55 and 71% of normal). April-September water supply forecasts are between 80 and 89% of normal for many more rivers throughout the state. But the atmospheric faucet is not due to be shut off quite yet, and at least from a water perspective, here’s hoping for some decent rains over the next couple of months, and especially nothing like the exceptionally dry spring of 2021.
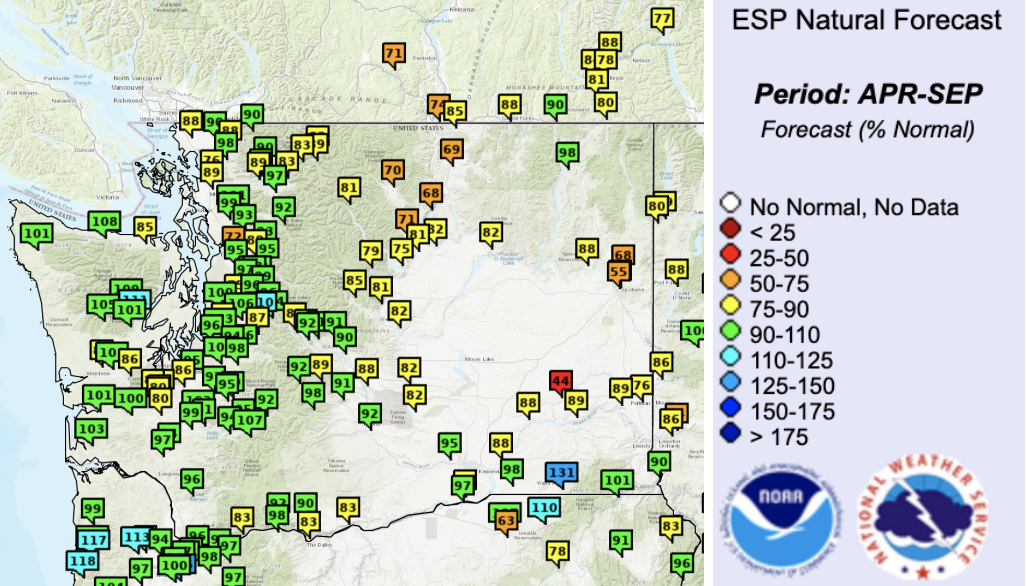 Figure 2: April-September 2023 natural water supply forecast in percentage of normal for WA as of March 30, 2023 from the NWS Northwest River Forecast Center. Forecasts are updated daily.