By Nick Bond
This piece is intended to complement last month’s piece on the decline of the frequency of heat waves in WA state during the late summer. More specifically, here we describe how soon we can expect to begin enjoying our fall rains, based on historical data. In our experience, perspectives on the onset of fall rains range widely with many western Washingtonians dreading the return of our gloomy season and others eagerly anticipating it. The anticipation generally comes from those that monitor our rivers and reservoirs, with a tendency to rejoice when those first significant rains fall. Regardless of your perspective, let’s take a look at the data.
We considered daily precipitation records at 5 stations in WA state over the period of 1971-2020, with a start date of 1 September. We calculated the frequency of years for which a daily precipitation total of 0.10” and greater, and 0.25” and greater, have been observed by 1, 7, 14, 21, and 28 September, and 5 October. In other words, we specify the onset of the rainy season by arbitrarily defining that timing as the first day with rainfall reaching the thresholds of 0.1” and 0.25”. The smaller value might plausibly constitute enough rain to qualify as a “rainy” day. But perhaps that is barely enough to wet the whistle, and so we repeated the procedure using the higher bar of a 0.25” threshold. Rainfall of that amount in September can mean the end of dragging the hose around the yard. The five stations examined are Hoquiam (HQM), Sea-Tac (SEA), Wenatchee (EAT), Walla Walla (ALW) and Spokane (GEG).
The results for the 0.10” daily rainfall threshold are plotted in Figure 1. It turns out that the 1st of September has been unusually rainy in western WA for the time of year, with probabilities of that threshold being met commensurate with those in the middle of the month. At any rate, it should be absolutely no surprise that HQM leads the pack with the highest probability of 0.10” falling throughout the entire 5-week period. We do think it is interesting that SEA almost catches up, by this measure, by the latter part of September. Folks near ALW and GEG need to typically wait longer for a 0.10” day, but their patience is rewarded with a 75-80% chance of that happening by the end September/early October. Wenatchee is in the shadow of the Cascade Mountains, and has only about a 50% chance of a wet day – by our definition of course – by the end of the month.
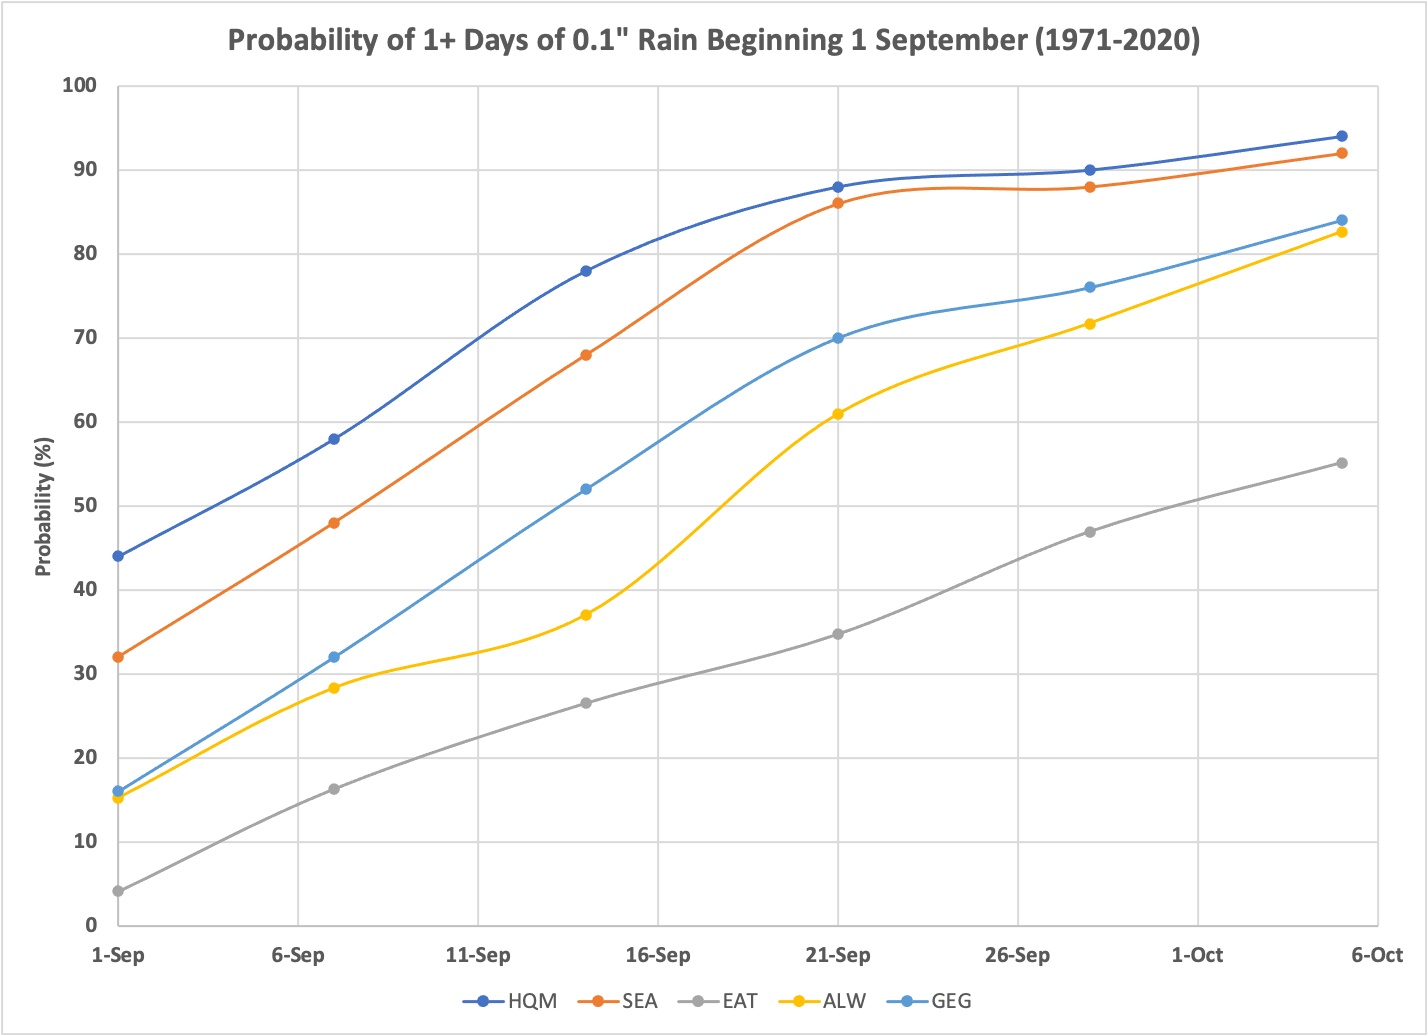 Figure 1: Accumulated probabilities of Hoquiam (HQM), SeaTac (SEA), Wenatchee (EAT), Walla Walla (ALW), and Spokane (GEG) receiving 0.10” of precipitation or more by 1, 7, 14, 21, 28 September, and 5 October (circles). The probabilities are accumulated so each circle must be higher as the days progress. Curves are smoothed.
The corresponding probability curves for the 0.25” daily total are shown in Figure 2. Again, the high frequency of this threshold being met at HQM on 1 September is a fluke. For the interval of 1 through 7 September, SEA has actually had a higher frequency of 0.25” days than HQM, due to the odd outcome that HQM has not had many of these days during the first week of the month if it did not have one on the 1st. We also note that ALW checks in with generally greater frequencies of 0.25” days than GEG; the opposite occurred with respect to the 0.1” days. For context, the mean precipitation totals for the Septembers of 1971-2020 in ALW and GEG are 0.75” and 0.68”, respectively. EAT is again a laggard with only about a 35% of 0.25” or greater by the end of the period examined; gutter cleaning services must not be in high demand.
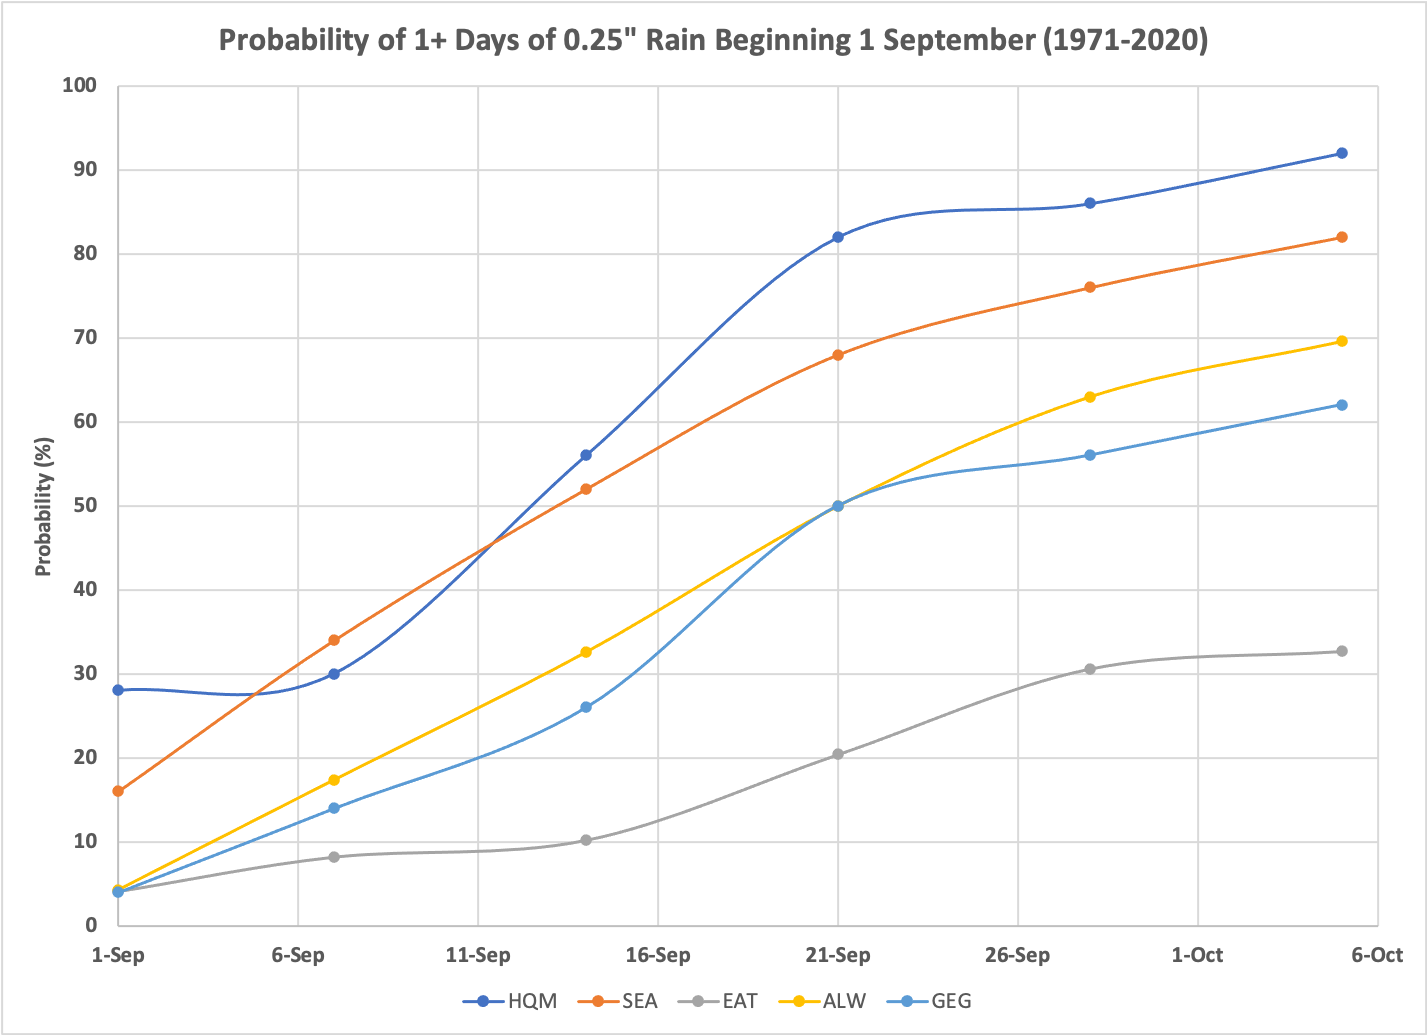 Figure 2: As in Figure 1, except for the threshold of 0.25”.
We conclude with a couple of thoughts about time series of daily rainfall amounts. First, we used a record of 50 years length, despite climatological norms often being computed over periods of 30 years. While 50 years is long enough for manifestation of meaningful trends in the climate, for the present application we assumed that it would be preferable to consider a relatively long interval from a statistical standpoint. Second, our method accounts for the temporal autocorrelation in daily rainfall on short time scales. It would have been easier to use the historical records of the probabilities of the two precipitation amounts on each day of the year of interest, and simply accumulate the probability of reaching those thresholds with day of the year. But that technique tacitly assumes that the probabilities of days within a year are independent of one another, which is definitely not the case. Instead, there are extended wet and dry streaks, with the latter resulting in occasional long waits for a rainy day. An example from the present analysis is telling. Given the daily probabilities at SEA from 1 through 14 September, the 0.10” threshold would be reached by 14 September during about 85% of the years, when in actually it has happened only 68% of the time. Perhaps Hoquiam represents an even more striking difference in that the probability of failing to have a day with 0.10” by 28 September is only about 0.2% considering each date independently, while such a failure has occurred 10% of the time. We are unsure if we should apologize to our readers for this digression, but the statistics geeks might not mind.
Registration is now open for the Oregon- Washington Water Year 2022 Recap and 2023 Outlook meeting that will take place virtually on the mornings of October 25 and 26, 2022. The goal of this meeting is to share and gather information regarding climate impacts of the 2022 water year. Some areas experienced continued drought while others dealt with flooding. The exceptionally wet spring and its impacts will also be a focus. An end- of-the-water year survey will be available soon to record impacts and actions taken to minimize those impacts, and will be discussed at the workshop. We encourage participation from a wide range of sectors. This event is hosted by NOAA NIDIS, UW CIG, and OWSC.