By Nick Bond
There are indications that La Niña may be present in the tropical Pacific during the upcoming winter of 2021-22 (see the “Climate Outlook” below). This was the case during the past winter of 2020-21, and more often than not, La Niña events come in pairs. The models used to predict El Niño /Southern Oscillation (ENSO) yield outcomes ranging from near-normal to decidedly cold conditions with the consensus indicating a weak La Niña. As is hopefully apparent to the readers of this newsletter, most of Washington state is in drought, and presumably the prospect of La Niña is good news.
What is the early half of the water year like in Washington state during the second year of back- to-back La Niña events? We previously addressed that topic in the October 2011 newsletter, and here follow-up with the additional events in the record, and by taking a somewhat different tack through consideration of the variability in statewide temperature and precipitation anomalies from case to case. We consider the months of October through December separately from the months of January through March, in recognition that the effects of ENSO appear to be more robust in WA state during late winter. Before examining the results for the individual events, it seems worthwhile to briefly examine the overall atmospheric circulation patterns during the 1st and 2nd La Niña events in the historical record. This is accomplished using – you guessed it – 500 hPa geopotential height anomaly maps for the two sets of years, as plotted in Figures 1a and b. These maps are composites for November through March under the assumption that October represents a month of transition into the cool season and maybe should not be lumped in with the others. At any rate, the two composite anomaly maps strongly resemble one another. The 500 hPa geopotential heights are somewhat lower over WA state during the first year La Niña events, but the sense of the implied flow anomalies tends to be a bit more out of the north during the second year La Niña events, and it is not obvious how our weather might differ between the two sets of years based on these maps.
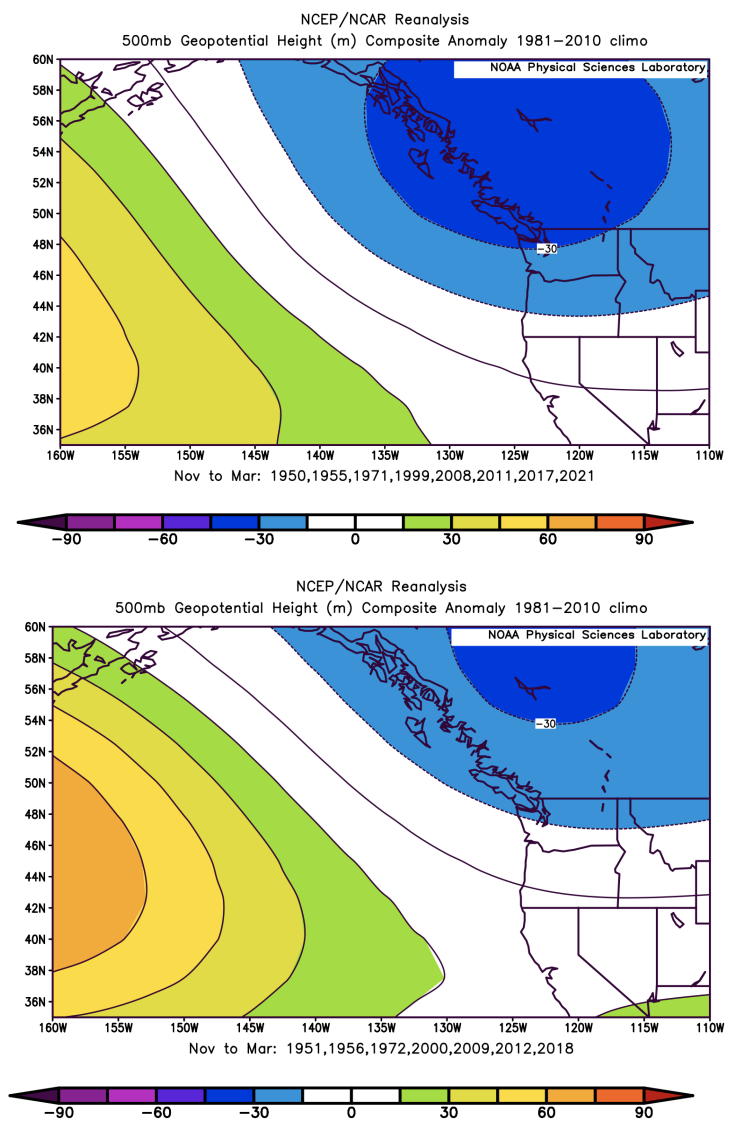 Figure 1: A composite of 500 hPa geopotential heights for the first year La Niña events (top) and the second year La Niña events (bottom; ESRL).
Towards resolving that burning question, we have itemized the statewide temperature and precipitation anomalies for the two sets of years in Tables 1-4. It tends to be on the wet and cool side during La Niña in general, as shown in the tables here, with the temperature anomalies often being more prominent in January through March versus the October through December period of the year before. There is also some tendency for the 2nd of the back-to-back La Niña events to include a stronger cool and wet signal early, and a weaker signal late, relative to the first-year events. That being said, there is plenty of variability in the temperatures and precipitation totals among the events that is not strictly related to the strength of La Niña, and so of course there is no guarantee that the upcoming cool season will get off to a great start. Moreover, the present drought is especially a problem in the non-irrigated regions of eastern WA. If atmospheric circulation patterns run true to form with enhanced westerly to northwesterly flow, the result would be copious precipitation mostly from the coast to the Cascade Mountains with the lower elevations of eastern WA not necessarily doing as well relative to normal. We’ll see.
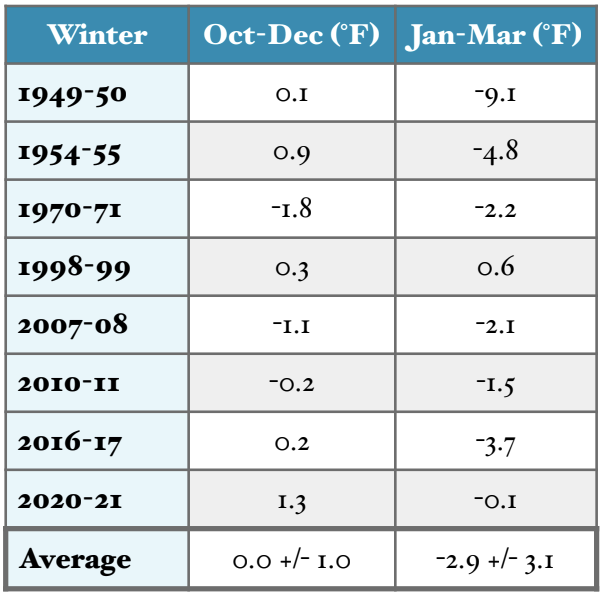 Table 1: Statewide temperature anomalies (compared to 1991-2020) during the first-year La Niña events.
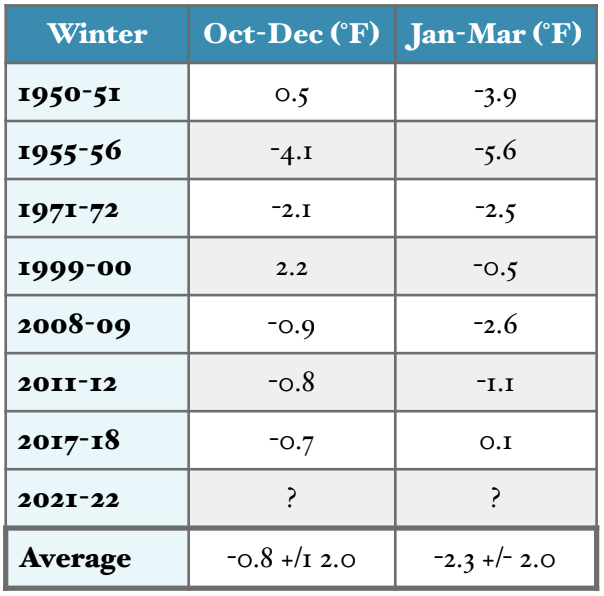 Table 2: Statewide temperature anomalies (compared to 1991-2020) during the second-year La Niña events.
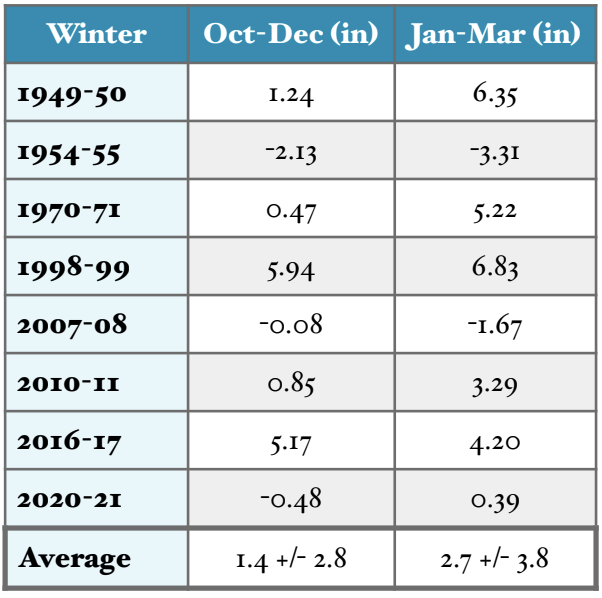 Table 3: Statewide precipitation anomalies (compared to 1991-2020) during the first-year La Niña events.
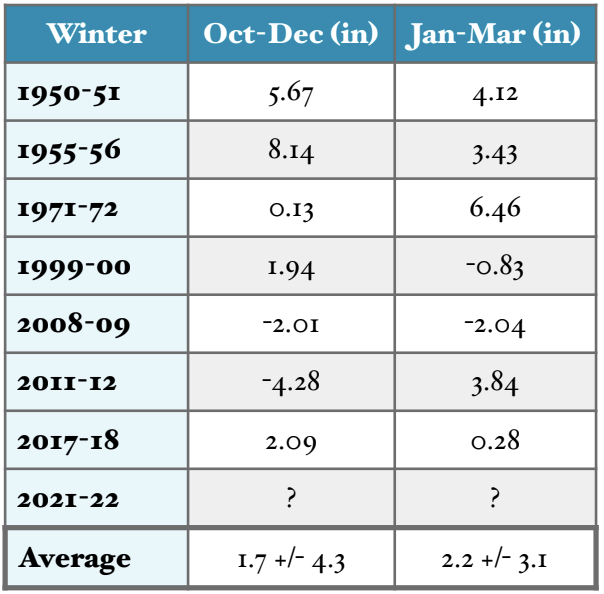 Table 4: Statewide precipitation anomalies (compared to 1991-2020) during the second-year La Niña events.