By Nick Bond
As must be well known by all the readers of this newsletter, the Pacific Northwest suffered through a severe heat wave at the end of June 2021. In association with extreme geopotential heights aloft and thermally-induced low pressure near the surface, many all-time temperature records were set. Much of the focus was on maximum temperatures, which is understandable in that temperatures in a variety of locations reached values that were much higher than in the past historical record. But minimum temperatures also were extreme, and this aspect of the heat wave presumably contributed substantially to the tragic number of fatalities that have been reported (e.g., The Guardian, KUOW). The objective of the present piece is to describe what occurred in the lower Columbian basin of eastern WA during the afternoon of 29 June 2021 when some of the most brutal conditions occurred, using the wet-bulb globe temperature (WBGT) as a measure.
The WBGT is based on the air temperature, humidity, wind speed, and solar radiation. It has been designed to reflect the thermal stress on humans in uncovered areas; Occupational Safety and Health Administration (OSHA), the military, and other organizations have activity guidelines using the WBGT to minimize the hazards of heat exposure. An advantage of using the WBGT over heat index is that it is a measure of heat stress in sunlight as opposed to shade for the latter. Here we estimate WBGT at selected locations during our past heat wave using a web application hosted by the Tulsa, OK office of the National Weather Service (NWS) with the following URL: https:// www.weather.gov/tsa/wbgt. That website includes the table (Table 1) on the implications of elevated values of the WBGT.
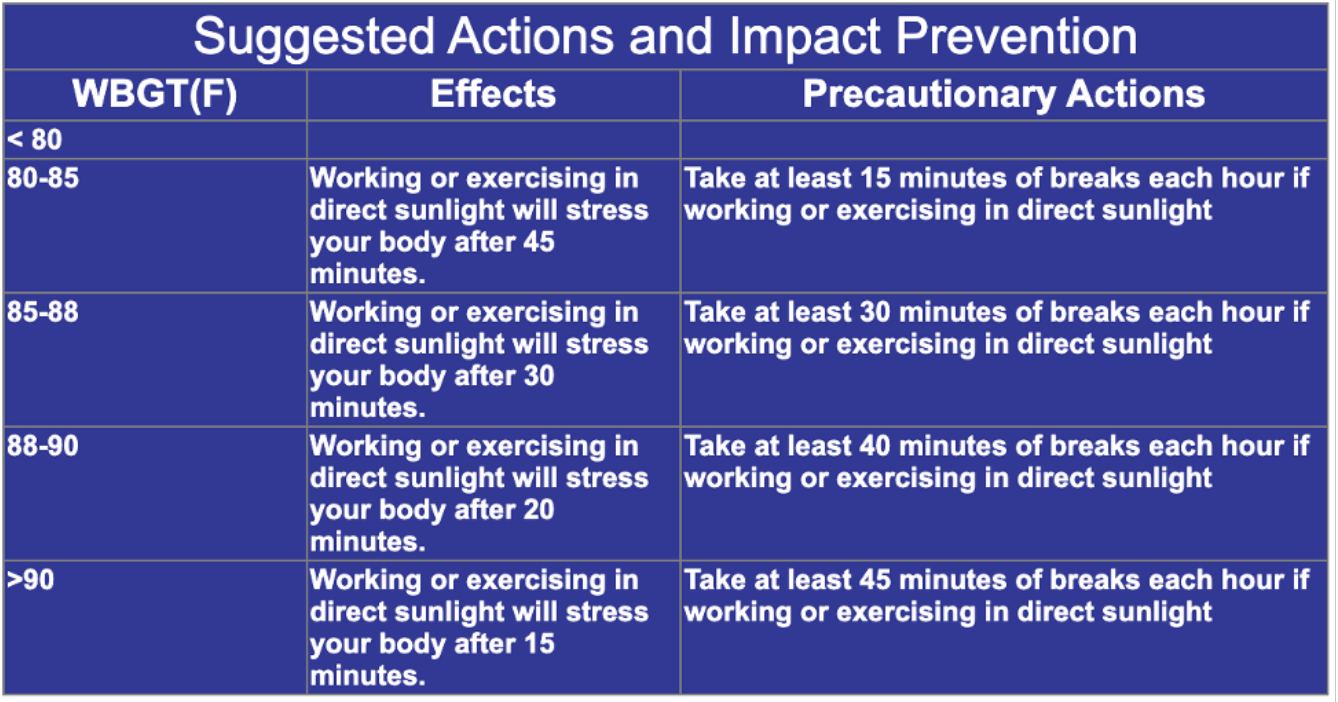 Table 1: WBGT thresholds, impacts, and suggested actions from NWS Tulsa.
Temperature and dew point observations at 00 UTC 30 June (5 PM local time) from the lower Columbia basin are shown here in Figures 1 and 2. These maps were produced using the widget provided by NOAA’s National Operational Hydrologic Remote Sensing Center (NOHRSC) at https://www.nohrsc.noaa.gov/interactive/html/ map.html. The preliminary observations are from stations that are part of different networks and there are likely reports that are not represented here. The consistency associated with the temperature observations suggests they are reliable. There are considerably greater local variations in the reported dewpoints. Hotter locations were also mostly drier (i.e., lower dewpoints), both in comparing stations close to one another and in considering regional differences. Regarding the latter, the reports out of the Yakima Valley and lower Columbia basin close to irrigated fields were generally a bit cooler and more humid with the reports from south of the Wahluke Slope (stretching from near Mattawa to southwest of Odessa) indicating higher temperatures and lower dewpoints. It is not obvious which places had conditions leading to a greater heat stress on humans, which is why the WBGT can be useful. For selected locations, we chose representative values for the air temperature, dew point and wind speed, and found the resulting magnitudes of the WBGT and heat index (which does not account for the wind or insolation) using the NWS application mentioned above. The results are itemized in Table 2.
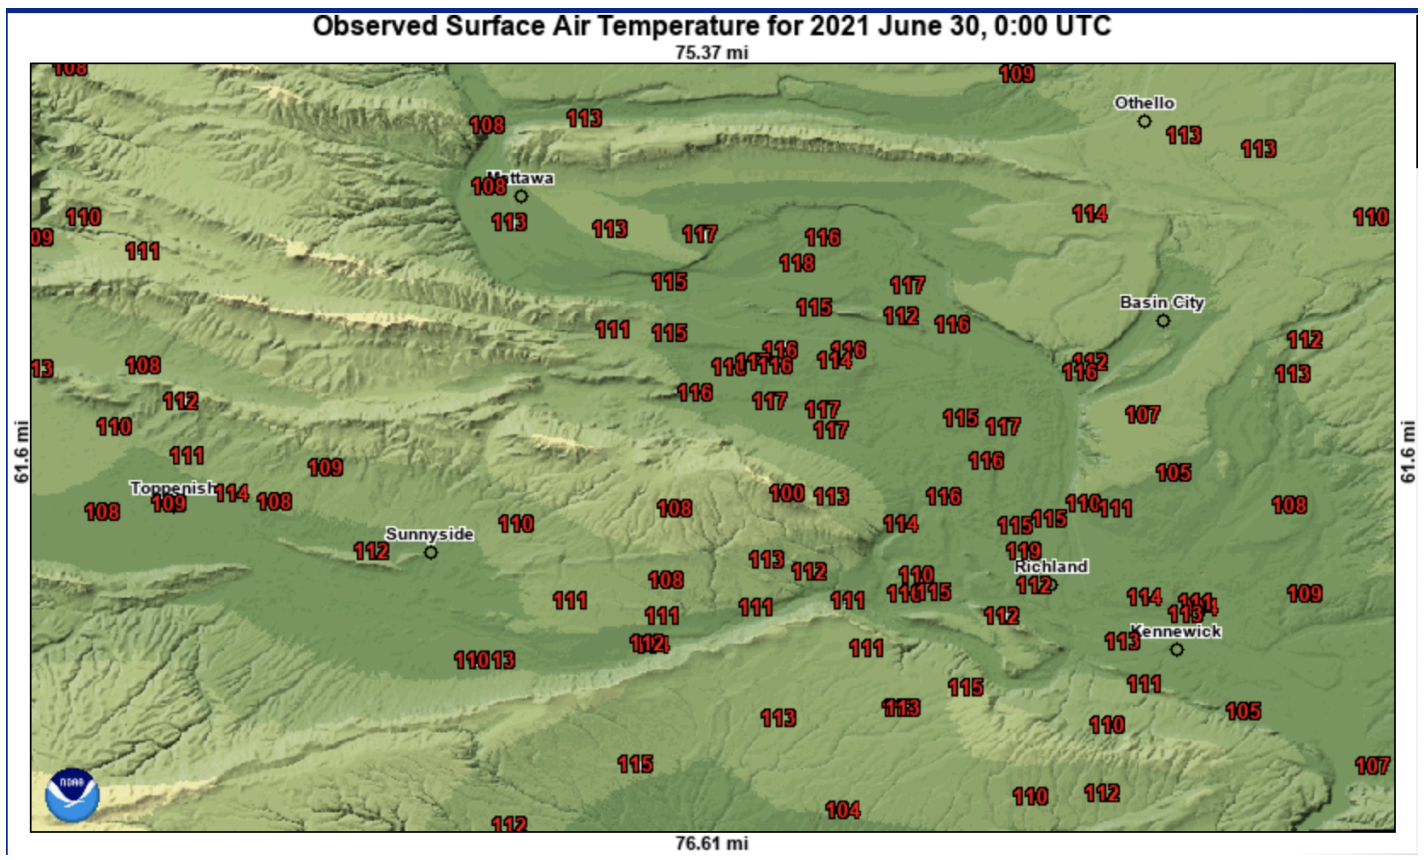 Figure 1: Temperature observations at 00 UTC 30 June 2021 (5 pm local time) in the Lower Columbia Basin from NOHRSC.
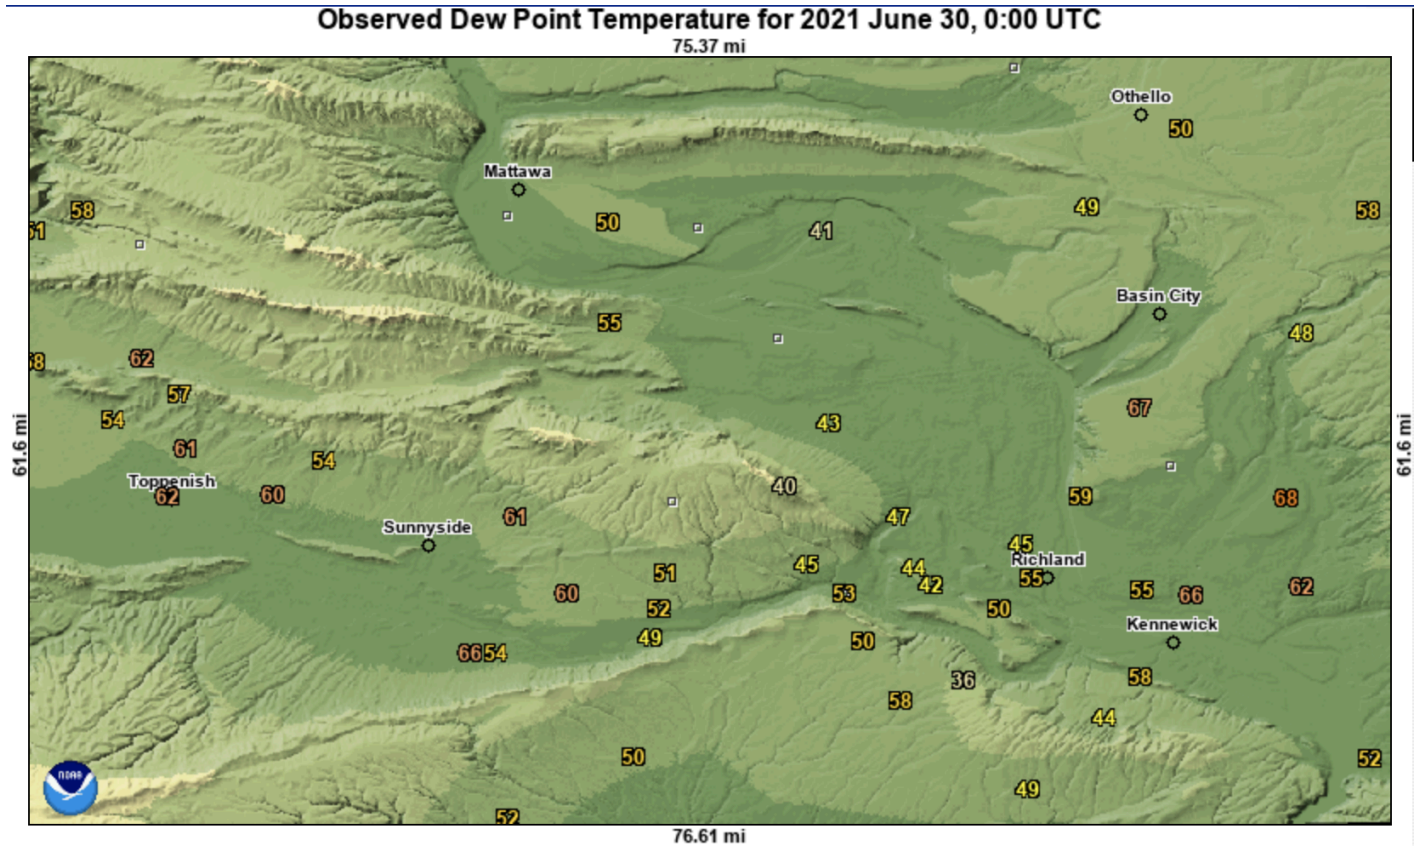 Figure 2: As in Figure 1, except for dewpoint temperature.
Before discussing conditions from the WBGT perspective, we would like to point out the high number of stations in the lower Columbia basin reporting temperatures above 115°F at 00 UTC 30 June 2021 (Fig. 1). The multiple reports in the range of 116-118°F give credence to the validity of temperature measurements of 119 to as high as 120°F at the Hanford Site north of the Tri-Cities which are currently under review by the State Climate Extremes Committee; reports from these stations are not included in Figure 1. Forecasters that monitor the weather for that site routinely see summer temperatures on hot days in the lower elevations of the Hanford site that are about 18°F warmer than those on Rattlesnake Mountain at an elevation of 1004 meters. As shown in Table 2, Rattlesnake Mountain reported a temperature of 100°F at 00 UTC, and its maximum temperature on 29 June was 102°F.
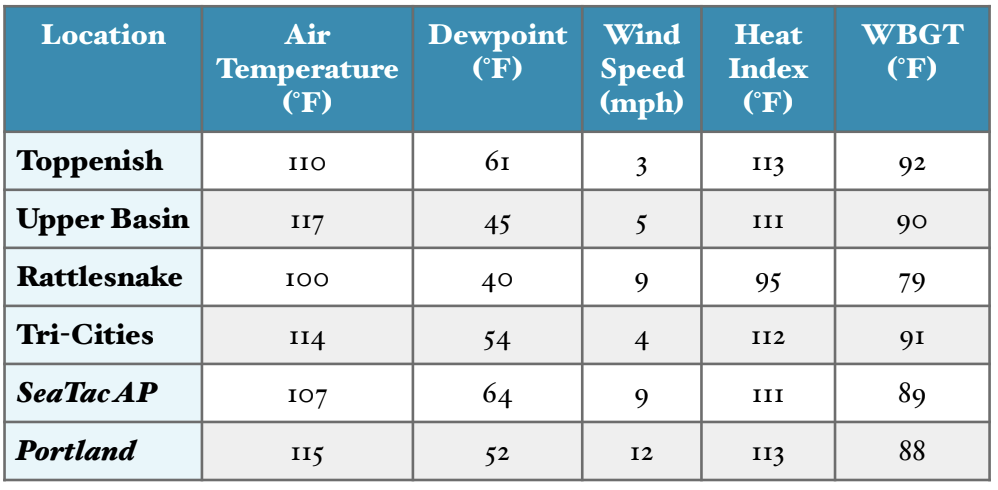 Table 2: Average air temperature, dewpoint, and wind speed for the locations listed from NOAA NOHRSC at 5 pm 30 June and the calculated heat index and wet bulb globe temperature. The values are representative of the locations selected rather than actual observations from individual stations. Reports from SeaTac and Portland Airport are also included; values here are from late in the afternoon on 28 June.
As indicated in Table 2, especially torrid conditions occurred in the Yakima Valley, as exemplified by the WBGT of 92 for the location of Toppenish. In general, more humid locations were worse from a human heat stress perspective even though they were a bit cooler. We note that it was also the case in comparing Seattle with Portland. The latter’s temperature of 115°F seems a lot worse than Seattle’s 107 (the high temperatures that day were 1°F greater at both locations), but Seattle had a considerably higher dewpoint temperature and somewhat weaker winds, resulting in a greater WBGT. A WBGT value of 90°F is generally considered a critical level, and at and above these values, the athletic organizations such as the New Jersey State Interscholastic Athletic Organization and others prohibit outdoor activities. This threshold was exceeded in portions of eastern WA on 29 June, and at least approached at Sea-Tac and other locations in western WA on 28 June. Given the record-breaking heat has been seared into our consciousness, we expect that most folks would not have any quarrel with policies protecting outdoor workers and athletes from unnecessary heat stress in these extreme conditions.