By Karin Bumbaco
The standard climate normal, or the 30-year average of weather conditions, is changing. Most anomalies and comparisons to normal conditions have been discussed using the average conditions between 1971 and 2000, but NOAA’s National Climatic Data Center (NCDC) has unveiled the “new normals” on July 1. The new normals essentially drop the oldest decade in favor of the more recent decade, and will consist of the averages in the variables between 1981 and 2010. The change in the normals is consistent with the World Meteorological Organization’s (WMO) recommendations to update the normals every 10 years.
NCDC is recalculating hourly, daily, monthly, seasonal, and annual normals, and those are available for temperature, precipitation, snowfall, and snow depth as of July 1. Some of the other products will not be available until Jan 1, 2012, and those include the frost/freeze date normals, climate division normals, and the heating or cooling degree day normals. This iteration of normals brings some new products that have not been included before. For example, “count normals” will be provided, which are the total number of days above or below a certain threshold in a month, season, or year. Another product included in this normal suite is the “pseudonormals”, which are estimates of the normal for stations that have less than a 30-year record. This is based on neighboring stations as described in Sun and Peterson (2005) and will be available for the Climate Reference Network (CRN) stations.
Though not an official indicator of climate change, you may expect the new normals to be warmer than the 1971-2000 averages. This is primarily because the decade of 2001-2010 is the warmest on record, and is now used to calculate the normals in place of the cooler 70’s (that’s temperature-wise, not a reference to bell bottoms). Figure 1, produced by NCDC, shows the difference between the new normals and the old for January (a) and July (b). As shown in the figure, most of the normals are now warmer for the US. It should be noted that some changes to the method of computing the normals has occurred with this iteration, but the comparisons in Figure 1 take into account those changes for an accurate comparison. The warmer normals should be kept in mind as the transition is made because hot temperatures will tend to be not as extreme since they are referenced to the new normals while cold temperatures may seem more anomalous. Additional information on the new normals can be found here: https://www.ncei.noaa.gov/products/land-based-station/us-climate-normals. Changes to several of the products on our website that use the 30-year normals will be implemented in the coming months. It should be noted that the change in several of the products featured in this newsletter will take some time, and the normals are still in reference to the 1971-2000 time period for this edition.
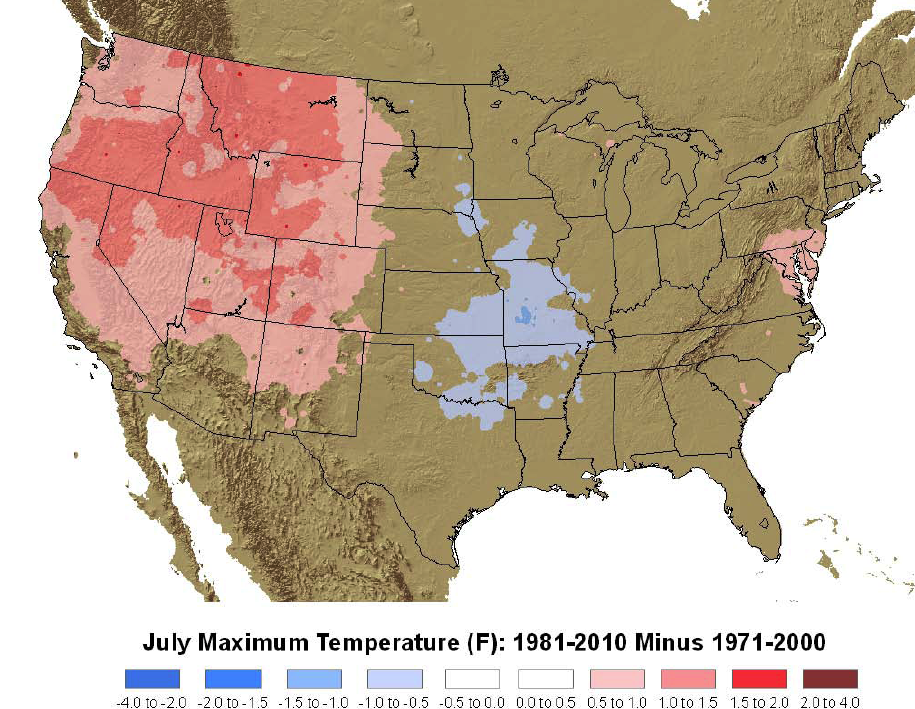 Figure 1a: The difference between the 1981-2010 normals and the 1971-2000 normals for the July maximum temperature and the January minimum temperature. The figure was produced by the National Climatic Data Center.
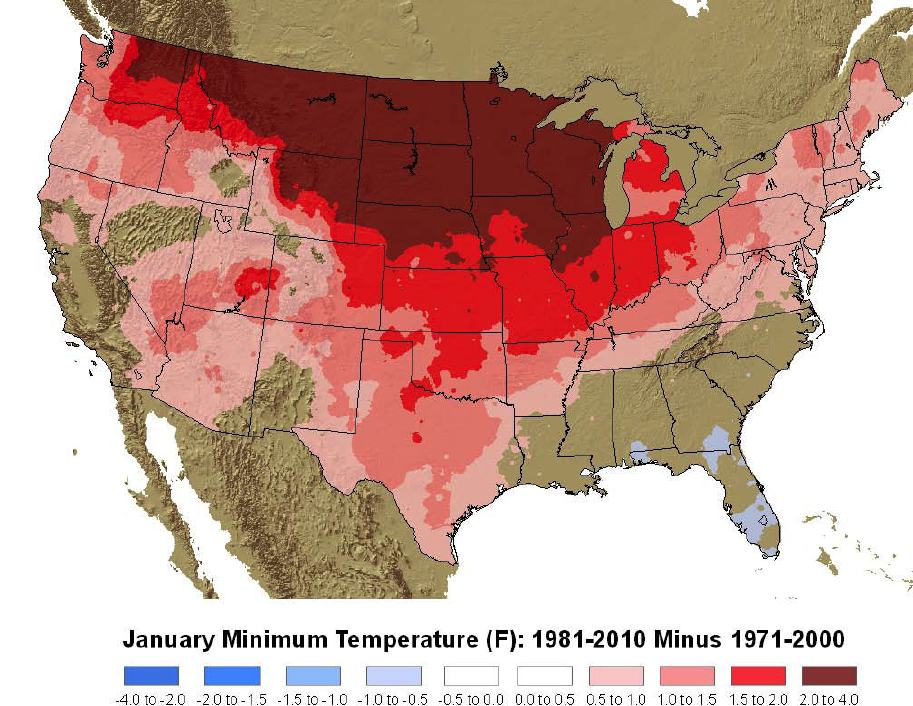 Figure 1b: The difference between the 1981-2010 normals and the 1971-2000 normals for the July maximum temperature nationwide (1981-2010 minus 1971-2000). The figure was produced by the National Climatic Data Center.