By Nick Bond
We expect that most regular readers of this newsletter have a good idea of how mean temperatures and precipitation amounts vary across the state over the seasons. These elements are typically used to summarize the climate of a location. But there are additional elements of the weather that vary systematically from place to place and month to month, of course, and here we consider one of those elements: the surface winds. There are significant temporal and spatial patterns in the winds due to the diverse landscape of Washington State.
Our focus is on monthly mean wind speeds and prevailing, i.e., most common, wind directions from the ASOS stations at airports across Washington State for the period of 1996-2006. This data set was compiled by the Western Regional Climate Center (WRCC) and is available from the following web site: https://wrcc.dri.edu/Climate/comp_tables.php. While 11 years is a rather short interval from a climatological perspective, the monthly means presented here should be mostly representative of their longer-term counterparts. A spot check of this record with longer-term averages for a few of the stations revealed no substantial discrepancies. The wind information is shown in tabular form, separating the stations on the west side from those on the east side of the Cascade Mountains. Only 7 months and the annual values are shown here due to space constraints; the full tables can be found at the WRCC link above. Mean sea level pressure maps for January and July of 1996-2006 from the NOAA’s North American Regional Reanalysis (NARR), as provided by NOAA’s Earth Systems Research Laboratory (ESRL), are included for context.
The monthly mean winds for the western Washington stations are itemized in Table 1. The strongest winds are in Hoquiam (HQM) during December and the weakest winds are in Toledo (TDO) in January. Perhaps it is no surprise that the coastal location of Hoquiam gets the top prize, but note the mean speeds at Quillayute (UIL) are much slower presumably due to this station being a few miles inland. The low wind speeds at TDO can be attributed to sheltering within the Cowlitz River valley. The second windiest spot on the west side is Whidbey Island Naval Air Station (NUW). This location is subject to mean wind directions between southeast and east in the cool season (October-March) and west winds during the middle of the year. This seasonal cycle in the direction of the prevailing wind makes sense given the mean sea level pressure (SLP) patterns, as illustrated for January (Figure 1a) and July (Figure 1b). Given the reversal in the mean east-west pressure gradient between the seasons (i.e., the tendency for air to flow from high to low pressure), the lack of much of a seasonal cycle in wind direction at Port Angeles (CLM) may be a surprise. We suspect that the westerly component at CLM during the winter may be a very local effect, specifically a response to frequent troughing in the lee of the Olympic Mountains in the vicinity of Port Townsend.
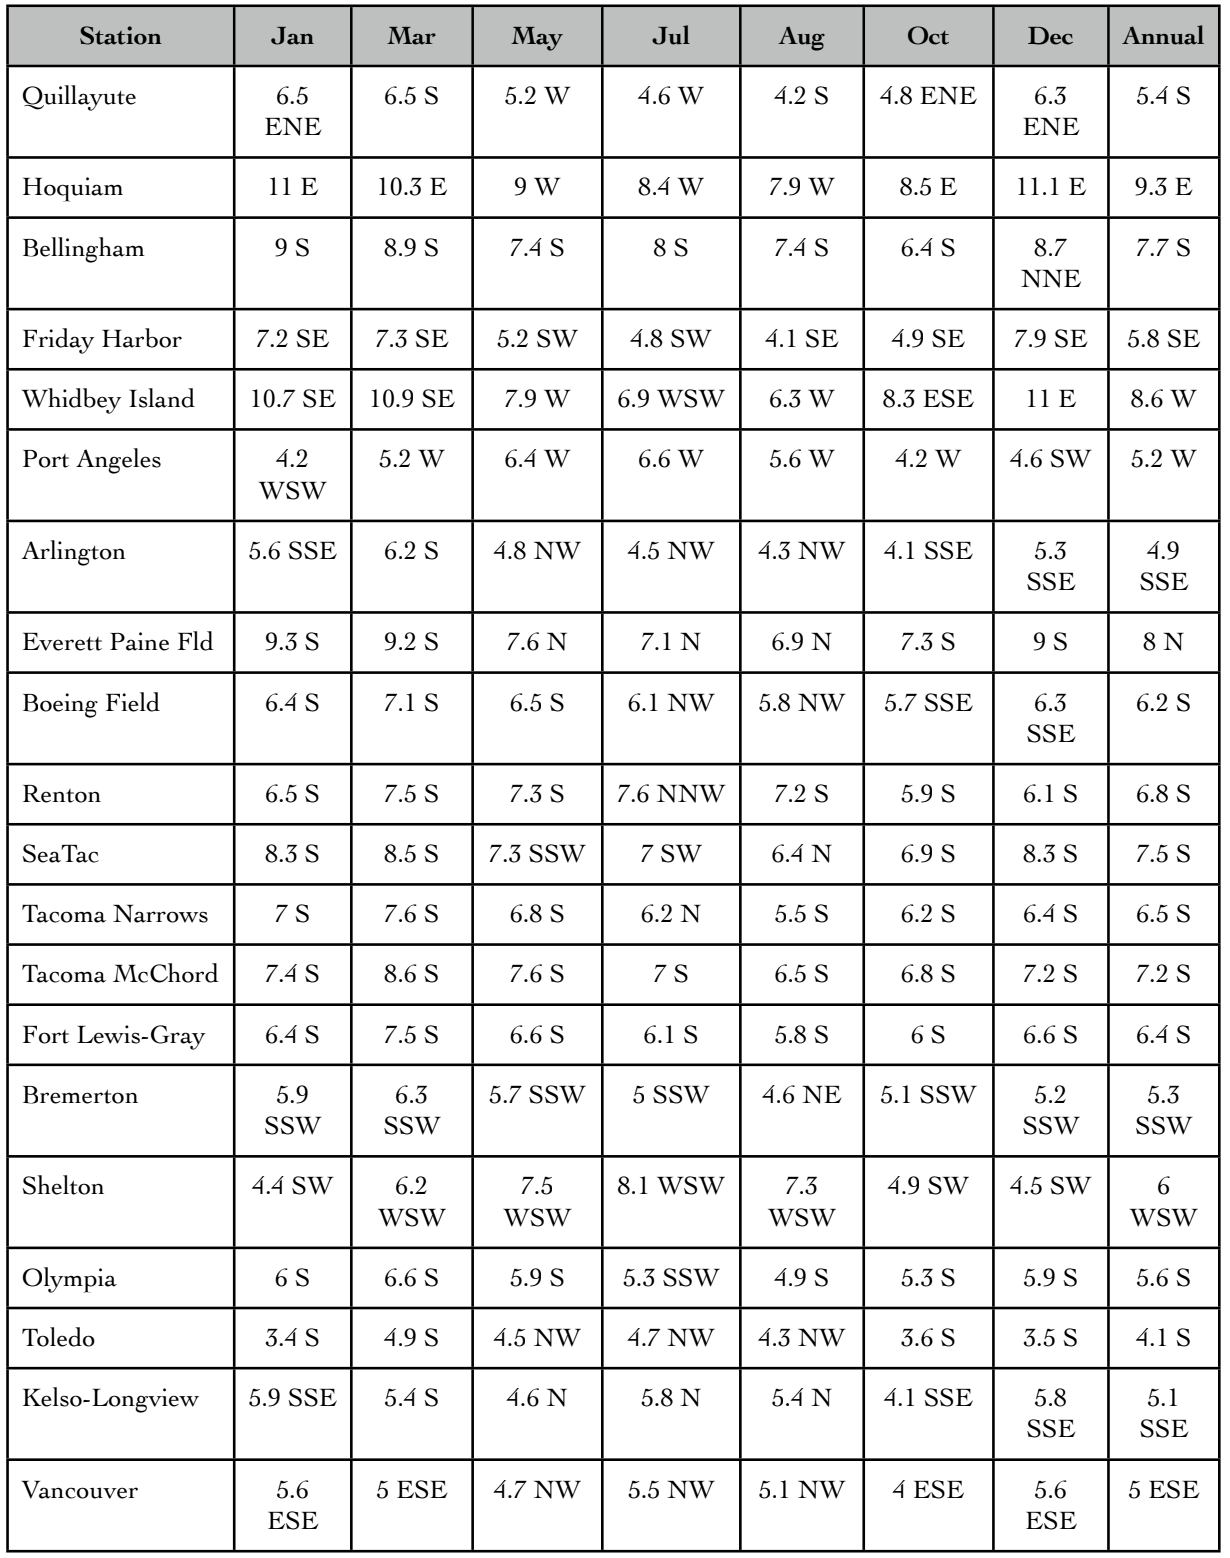 Table 1: The mean wind speed and direction for airport sites in western WA for a sample of months using data from 1996 through 2006. Full tables can be viewed at the WRCC website.
Seasonal changes in wind direction are also minor in the southern Puget Sound locations of McChord Air Force Base (MCC), Gray AAF (GRF), Shelton (SHN), and Olympia (OLM). The south to west-southwest winds are close to parallel to the isobars in winter and across them in summer, and in both cases, appear to be associated with marine air flowing through the conduit represented by the low terrain to the south of the Olympic Mountains (as indicated in Mass 1982). The three station of Boeing Field (BFI), Renton (RNT), and SeaTac (SEA) in King County are quite near each other, but display some interesting differences. BFI is tucked into the Duwamish River Valley and tends to have the lightest winds. SEA is at the highest elevation and has the strongest mean winds, except during summer. During that time of year the winds tend to be from the north, and hence the relatively stronger winds at RNT may be due to the reduced friction associated with the presence of Lake Washington immediately upstream.
The mean monthly winds of eastern Washington are itemized in Table 2, and also feature plenty of quirks. The strongest winds by a large margin are the northwesterlies in Ellensburg (ELN) during summer. This location is near the downstream exit of one of the more prominent gaps in the Cascade Mountains. Too bad there are no large bodies of water because it otherwise might be a mecca for windsurfing, since the ELN winds are actually stronger than those in the Columbia River gorge at The Dalles, OR (not shown). The weakest east side winds are found not far away in Wenatchee (EAT) during the middle of winter. It stands to reason that this location, and to a lesser extent, Yakima (YKM) and ELN, tend to experience weak winds during this time of year because statically-stable temperature profiles are common in association with cold air banked against the east flank of the Cascades. It is not evident why the mean directions are from the west, but perhaps it is due to the drainage of cold air off the slopes to the west during the long winter nights. Most of the stations in eastern Washington tend to have stronger winds during the summer than the winter. This result contrasts with that for western Washington, which has stronger winds in winter on average at most locations. The three Spokane stations offer another opportunity to examine the variations in the winds over short distances. Fairchild Air Force Base (SKA) and Spokane International (GEG) are separated by only 3-4 miles and are situated in similar terrain to the west of the city of Spokane and their winds are comparable, with the exception of late in the calendar year. On the other hand, Felts Field (SFF) is located along the Spokane River just east of town, and while it is only about 12 miles distant from SKA and GEG, its mean winds are consistently weaker, and generally out of a different direction, during much of the year. The winter winds in Spokane area generally include a northerly component, at least at SKA, GEG, and Deer Park (DEW). This might seem inconsistent with the overall SLP pattern but could reflect down-gradient flow into relatively low pressure over northern Idaho (Fig. 1b). It should be noted that for the latter region of higher terrain the reduction of station pressure to sea-level may introduce errors.
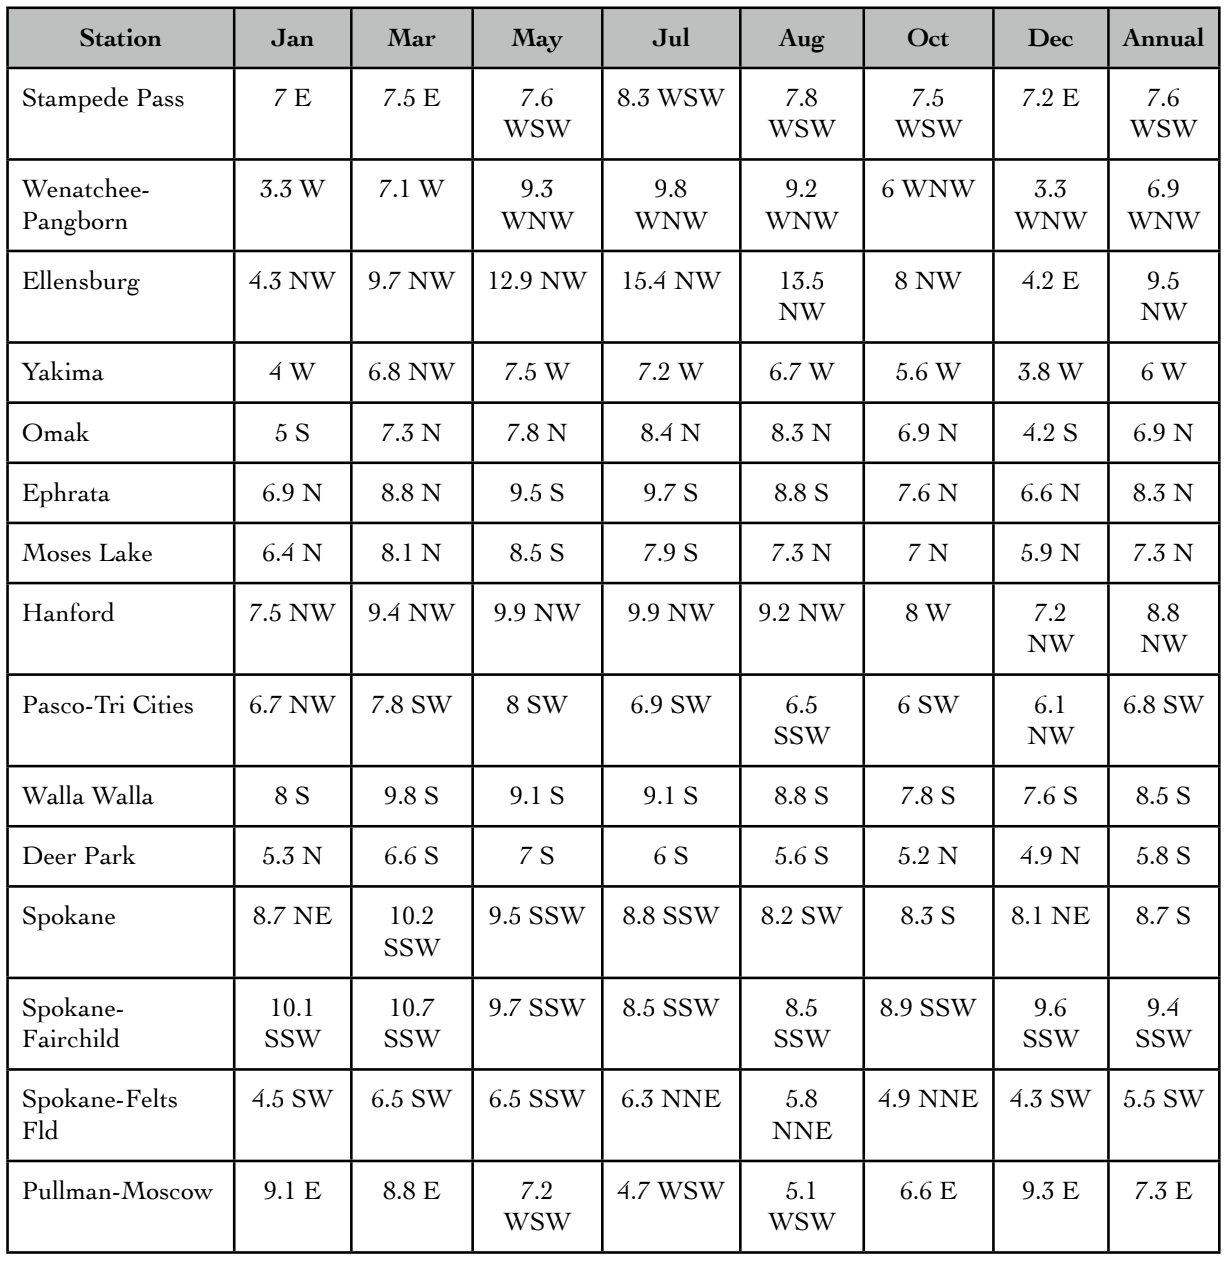 Table 2: As in Table 1, except for eastern WA.
We have only begun to scratch the surface of the temporal and spatial structure in these wind data. We encourage readers to check out some of the other idiosyncrasies in this data set, and see if they can puzzle out their own explanations for the marvelous contrasts in this facet of the weather across Washington State.
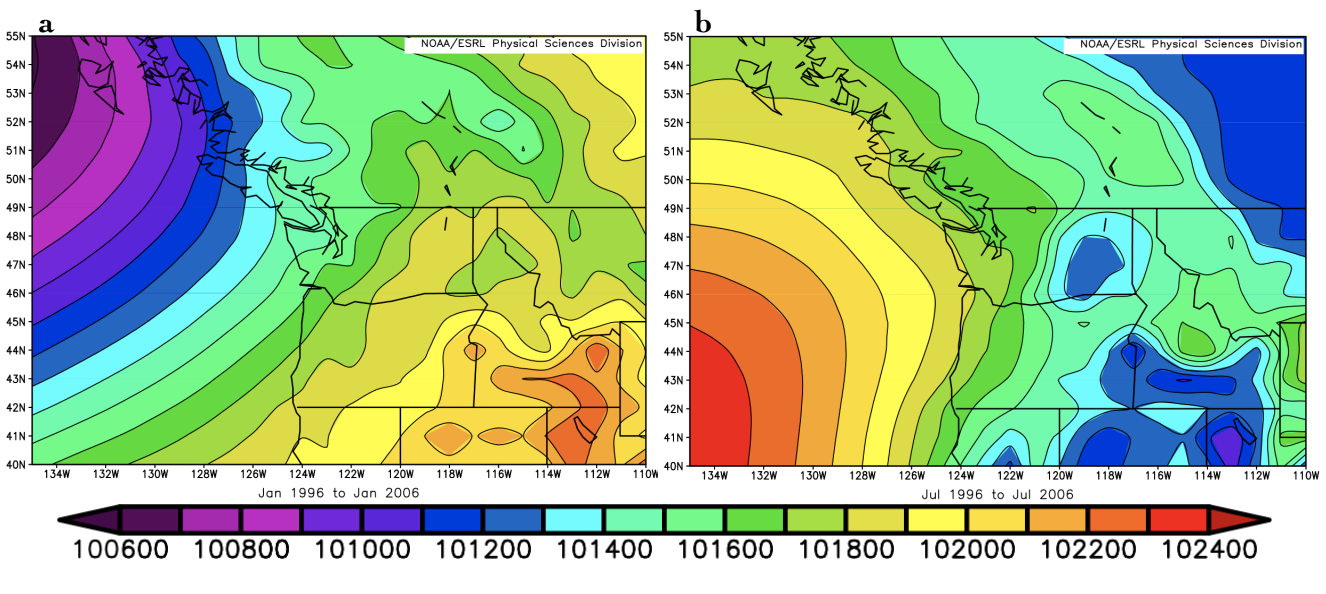 Figure 1: Mean SLP during (a) January and (b) July of 1996-2006 (contour interval 100 Pa) from the North American Regional Reanalysis (NARR).
Reference
Mass, C.F. (1982): The topographically forced diurnal circulations of western
Washington state and their influence on precipitation. Mon. Wea. Rev., 110, 170-183.