By Nick Bond
There has been a slight upward trend in mean precipitation for Washington state over the last century or so, but this change is marginal from the standpoint of statistical significance. Readers are encouraged to explore this for themselves using an application on the OWSC website: www.climate.washington.edu/trendanalysis. Mean values of precipitation on monthly and longer time scales are important for many applications, of course, but that is not the whole story. A separate issue concerns whether extreme short-term precipitation events are getting more frequent or intense. A recent publication of the National Climate Assessment (ncadc.globalchange.gov) suggests that extreme precipitation events are on the rise for most of the US but to a lesser extent for the Pacific NW. OWSC decided to take a quick look on its own at this issue. For this purpose we have considered cool season (October-April) and warm season (May-September) separately, since the weather patterns promoting heavy precipitation events tend to be quite different in the two seasons.
The results shown here are based on daily values of precipitation from station data; 5 stations each in western WA and eastern WA representing different parts of the state. The stations selected have relatively complete records of daily precipitation data back to 1950 and provide more-or-less complete geographic coverage. Towards that end, a mountain station was included in both the western group (Mt. Rainier) and the eastern group (Stehekin). Shown below are the intensity (in relative terms for each location) and year of occurrence of the top ten events at each of the 5 western stations and 5 eastern stations for the cool season and for the warm season.
The stations chosen are far enough apart so that extreme 1-day precipitation events tend to occur at individual rather than multiple stations. Only about 15% of the events in western Washington occurred at multiple stations; less than 10% did so east of the Cascades. In terms of the correspondence between west and east, about 10% of the winter events were included in the top ten lists of both a western and an eastern station. In summer only 5 or about 5% were of this type. Moreover, two of these occurred during the last week of September and so while included in the warm season set may well have been winter-like storms. This aspect of the results was no great surprise given the localized nature of heavy rains, but still, we did not expect almost a complete lack of overlap. This is not so much the case for heat waves, for example, which tend to be manifested on broader spatial scales across the Pacific Northwest.
Our primary interest in examining the daily precipitation records is to determine how the extreme events have been distributed over the years from 1950 to the present. For the western Washington cases in the cool season (Figure 1), there is a noticeable preponderance of events in the latter half of the record. Nothing of this sort is evident for the western stations as a group for the heaviest rainfalls in the warm season (Figure 2). Meaningful trends in the intensity of the most extreme events are lacking in both seasons. While not evident from the data as plotted, there is also an increased probability of cool season events occurring at multiple stations in western Washington during recent decades (none occurred before 1977 among the 5 stations used here).
For eastern Washington, cool season extreme events were relatively frequent in the 1990s, i.e., 40-50 years from the 1950 start to the period considered here, but an overall trend is lacking (Figure 3). There does seem to be a modest increase in the number of extreme events in eastern Washington during the warm season (Figure 4), but it is unlikely that this increase is robust from a statistical significance perspective. Similar to western Washington, it does not appear that the 1-day rainfall events have changed in intensity east of the Cascades.
The results turned up here are mostly consistent with recent research, such as the Mass et al. (2011) extreme precipitation study that focused on the coastal zone and the Janssen et al. (2014) study that examined extreme precipitation in the Pacific Northwest as a whole. We find the uptick in cool season events in western Washington intriguing, but caution that not too much should be made of them. More stations need to be included to put this highly tentative finding on a firmer foundation. If indeed a real change has occurred, it would be interesting to delve into whether it was more attributable to an increase in humidity, or more due to the dynamics (regional circulation patterns favoring heavy precipitation).
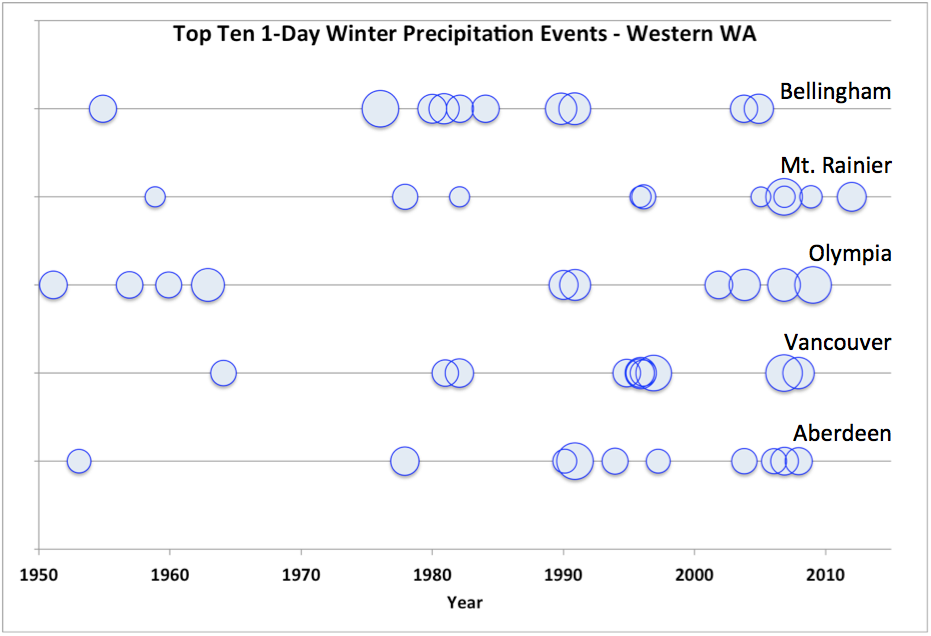 Figure 1: The top ten winter (October-April) daily precipitation events since 1950 for 5 stations in western WA. The size of the circle is proportional to the magnitude of the event for each station record, separately.
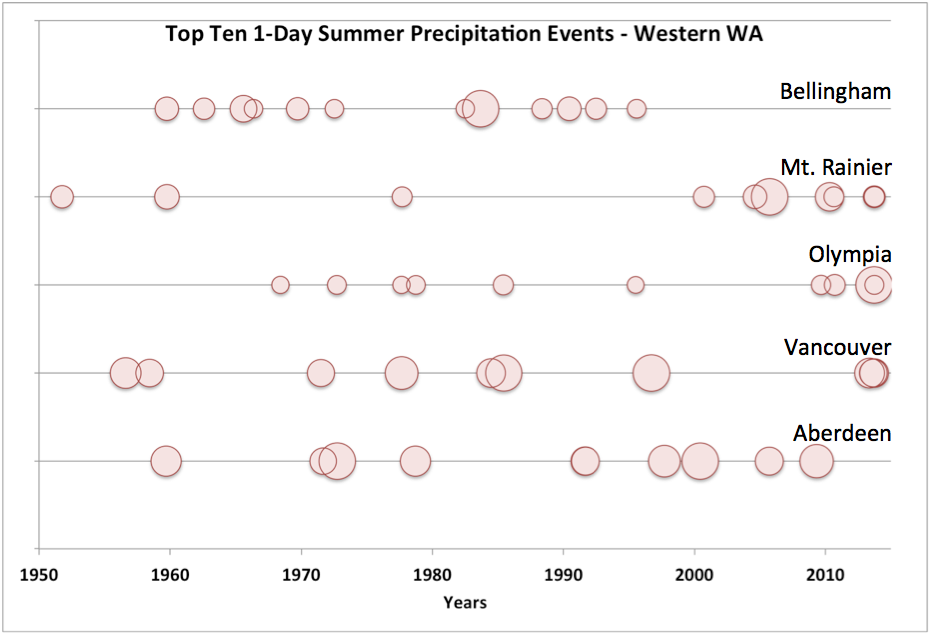 Figure 2: As in Figure 1, except for summer precipitation (May-September).
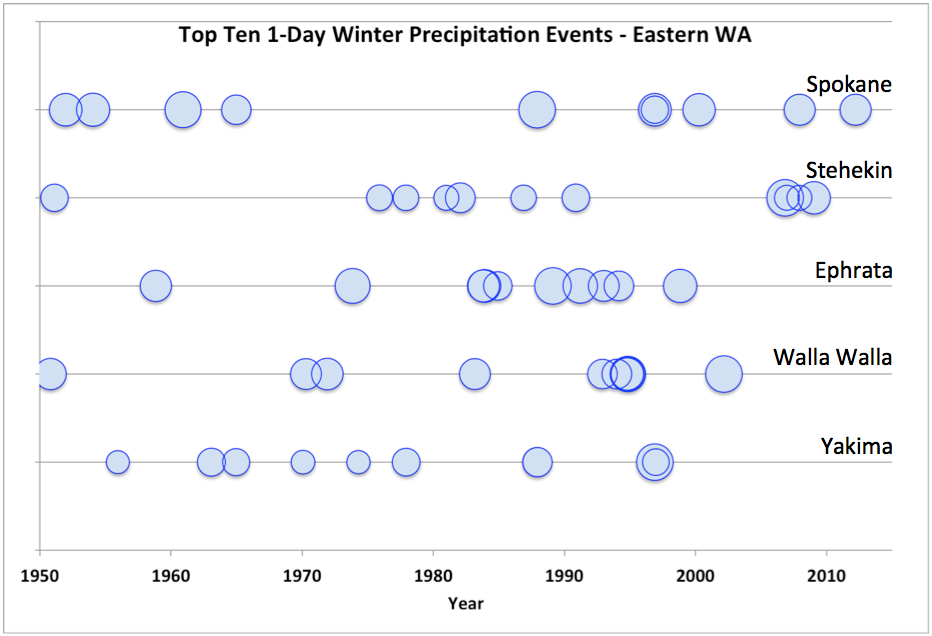 Figure 3: As in Figure 1, except for eastern WA.
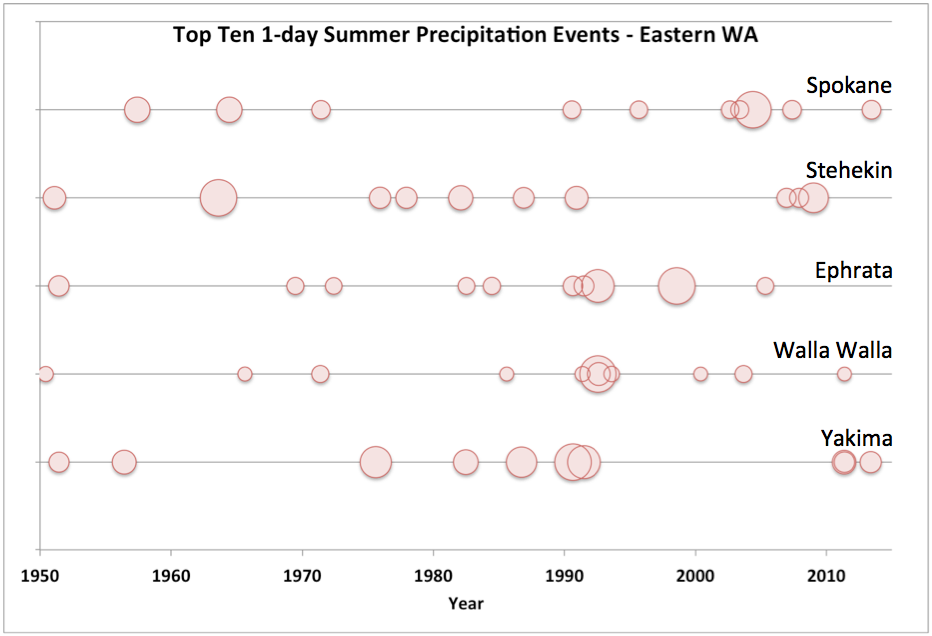 Figure 4: As in Figure 1, except for eastern WA summer precipitation (May-September).
References:
Janssen, E., D.J. Wuebbles, K.E. Kunkel, S.C. Olsen, and A. Goodman, 2014: Observational- and model-based trends and projections of extreme precipitation over the contiguous United States, Earth’s Future, 99-113.
Mass, C., A. Skalenakis and M. Warner, 2011: Extreme precipitation over the west coast of North America: Is there a trend? J. Hydromet., 12, 310-318.