By Jacob Genuise
Global oceans have been very warm since 2023
It is no secret that global Sea Surface Temperatures (SSTs) have been steadily increasing for decades (Fig. 1) due to climate change. Notably, conditions since 2023 have been considerably warmer (highlighted in yellow on Fig. 1), raising the question of what may be driving this and what it may mean for global weather and climate.
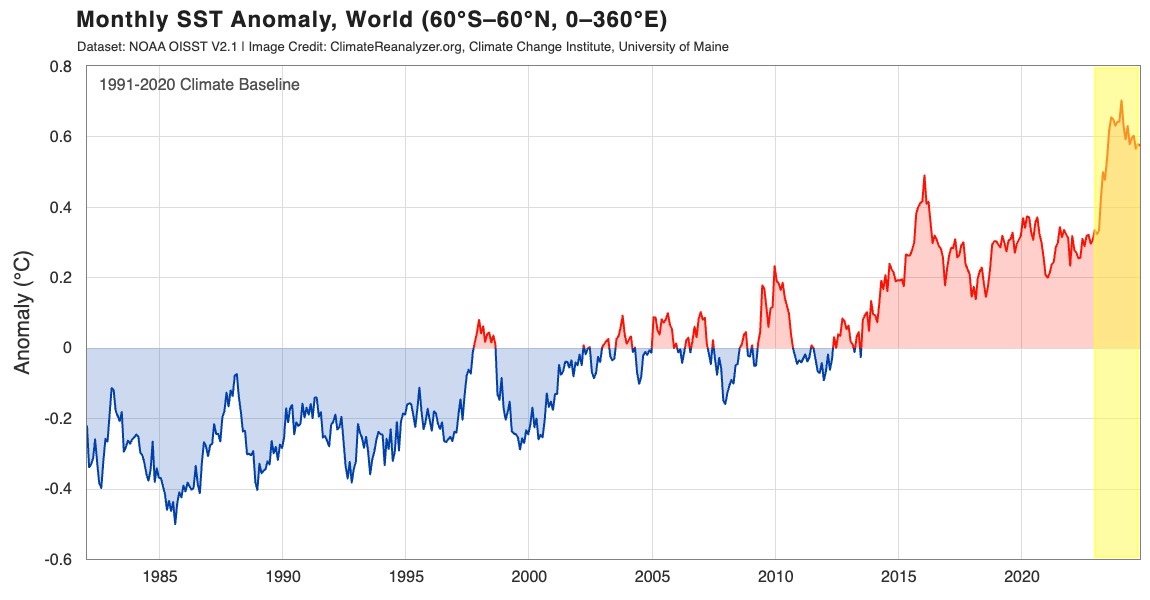 Figure 1: Monthly Global SST relative to the 1991-2020 average, plotted from 1980-2025. Note the general warming trend as well as the recent warm conditions since 2023 in the yellow highlighted region (University of Maine, Climate Reanalyzer).
These warm temperatures are likely due to a combination of natural climate variability (such as El Niño/ La Niña), one of the main drivers of global SST variations, as well as long-term warming due to climate change (Samset et al., 2024).
The 2023-2024 winter featured the strongest El Niño event we have seen since 2015-2016, which contributed to these record warm SSTs. However, warmer than normal SSTs have held strong through 2024 and continue into 2025, despite the end of our El Niño event by early summer 2024 and then a transition to a weak La Niña by January 2025 (CPC)(Fig. 2).
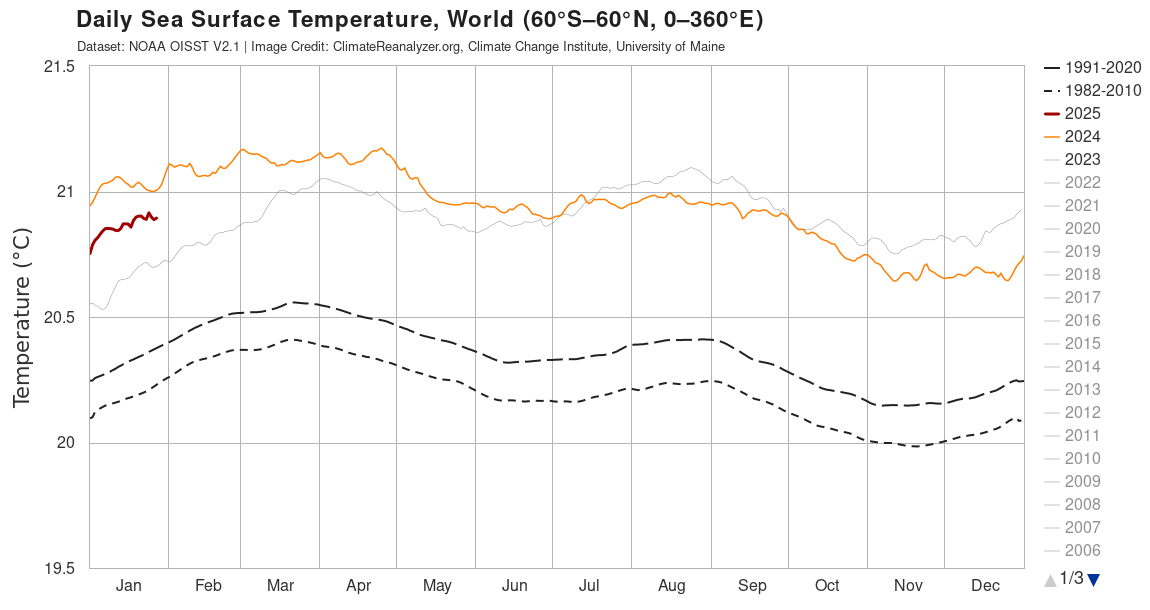 Figure 2: Daily Global SST. Long and short dashed lines represent the 1991-2020 and 1982-2010 mean climatologies, respectively. The gray line represents the beginning of the recent warm event in 2023. SSTs remain high in 2024 (orange line) and into 2025 (red line) (University of Maine, Climate Reanalyzer).
How do warming oceans change how we categorize El Niño and La Niña?
To investigate this question, let’s revisit how El Niño/La Niña are defined and identified. The CPC defines these events based on the difference in 3-month mean SSTs in a specific region in the Tropical Pacific relative to a 30-year mean SST over the same region (CPC uses the “Nino 3.4” region, which is centered about 4,500 miles off the west coast of South America). The result is the Oceanic Niño Index (ONI), where positive values +0.5°C indicate El Niño conditions (i.e. a warm anomaly in SSTs), and negative values -0.5°C indicate La Niña conditions (i.e. a cold anomaly in SSTs). Values between 0.5°C are considered neutral. Other agencies around the world have slightly different thresholds for defining El Niño/La Niña events, but they all rest on the same basic comparison between mean background tropical SSTs (typically the most recent 30-year average) and recent 3-month anomalies in the Tropical Pacific.
Given that ONI relies on a long-term 30-year mean SST period, it doesn’t account for short term changes in SSTs such as the warm conditions we’ve been experiencing since 2023. Because it’s been so warm, cold anomalies in the Tropical Pacific (La Niña) are likely being hidden, and warm anomalies (El Niño) are being artificially inflated by this short-term background warming.
To give a more concrete example, let’s look at our current weak La Niña event. From the CPC, the Nov-Jan anomaly is -0.5°C. This value is currently being calculated using the 1991-2020 average SSTs over the Nino 3.4 region. However, SSTs in the tropics have been running around +0.3-0.4°C above this 1991-2020 baseline over the past few months and up to +0.7-0.9°C at times since 2023 (Fig. 2). This means that we’re only just barely in a La Niña compared to our 1991-2020 baseline, but getting into moderate La Niña territory relative to the warm conditions we’re experiencing today.
Given that declaring an El Niño or La Niña event comes down to a difference of only 0.5°C from baseline conditions, short-term changes in tropical SSTs could significantly impact whether El Niño or La Niña events are declared in real-time and at the correct intensity. As noted above, it is entirely likely our cool La Niña anomaly for 2024-2025 is actually stronger than the standard ONI would suggest.
The CPC has already made some changes to the ONI method to incorporate background SST warming trends due to climate change by updating the 30-year average SSTs every 5 years. Read this article for more information on these updates to ONI. However, this updated method still results in a lag in real-time ONI values until a new 30-year climatology is ready. Crucially, this lag raises operational questions since timely issuance of an ENSO advisory often influences the decision-making of hydrologic managers and global-scale economic and human response efforts. For example, see the UN Food and Agricultural Organization’s recent La Niña Anticipatory Response Plan to read more about response efforts to our current La Niña event.
Toward a New ENSO Index
Some have proposed creating a Relative ONI, or RONI, that can take into account background mean SST changes in the tropics on a shorter timescale, and therefore define ENSO events in real-time more accurately. L’Heureux et al. (2024) recently developed a simple definition for RONI, expanding upon a similar method first identified by Van Oldenbourgh et al. (2021).
Circling back into our current 2024-2025 La Niña event, the standard ONI based on the 30-year mean SSTs yielded a La Niña index of -0.5 for the Nov -Jan period according to the CPC (based on the cooler 1991-2020 baseline). However, when adjusted for the recent accelerated SST warming, the RONI yields a value of -1.09°C for Nov – Jan. This once again means we could be in the midst of a stronger La Niña event than the ONI would suggest.
What might this mean for spring snowpack in Washington?
Like most years, the ENSO phase merely tilts the odds toward cooler/warmer or wetter/drier seasonal winter averages, and other global circulation patterns along with shorter-term weather patterns also play an important role in all ENSO events. However, L’Heureux et al. (2024) found that RONI is a bit better than ONI at explaining precipitation anomalies due to El Niño/ La Niña with around 5-10% better correlation with precipitation in the Southern US and 1-3% in much of Washington state (see Fig. 13 in L’Heureux et al., 2024).
Given how dry January was, we will need above normal precipitation through the rest of the season. A stronger 2024-2025 La Niña, according to the RONI method could tilt the odds towards wetter conditions, and would help to explain why seasonal climate models have consistently predicted a wet late winter/early spring 2025 in the PNW (Fig. 3), despite a seemingly weak La Niña event according to the standard ONI.
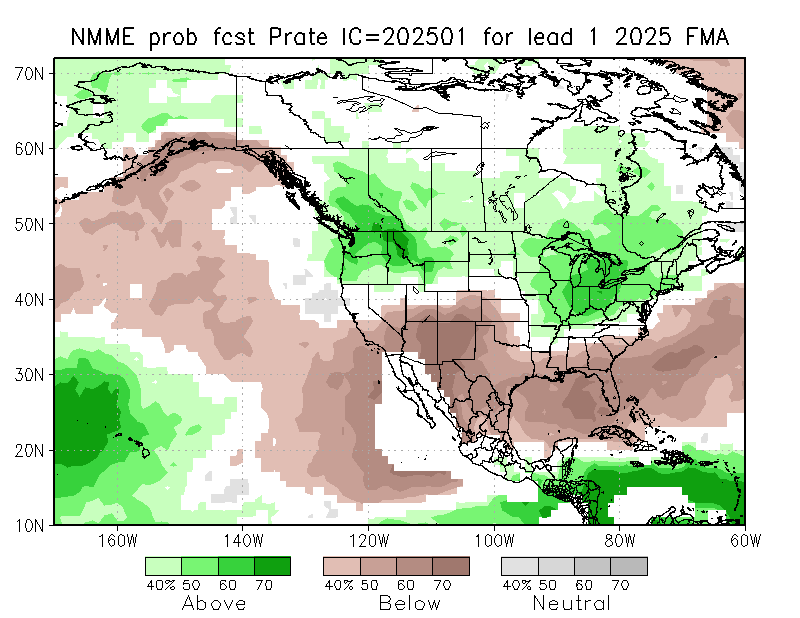 Figure 3: 3-month probability of above, below, and neutral precipitation from Feb – Mar 2025 according to the North American Multi-Model Ensemble (NMME). Models continue to point to a wet late winter and early spring 2025 for the PNW.
These climate models show a less robust signal for temperatures with equal chances of above, below, and near-normal temperatures over this same period. Sub-seasonal to seasonal models (1-4 weeks and 1-3 months out from present, respectively) are not perfect, but there is good consensus that late winter will bring above normal precipitation.
Finding years in the historical record that had a RONI near this season’s value of -1.09°C can give us a glimpse into how the winter will play out. For this analysis, we identified cold seasons in the historical record with a minimum RONI index between -1.30°C and -0.80°C for at least 3 consecutive 3-month periods. Figures 4 and 5 show the average Feb – Apr temperature and precipitation anomalies for past years with similar RONI values. These anomalies were calculated based on a 1981-2010 normal period in order to center the analysis more closely to the whole range of years used (1971-2023).
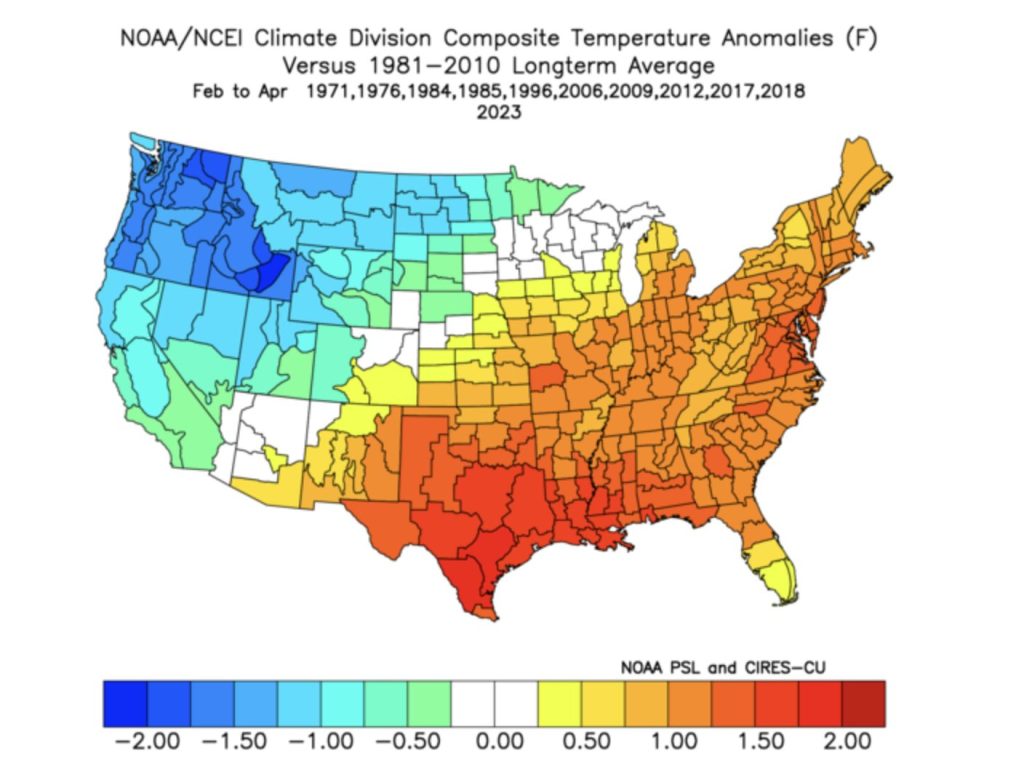 Figure 4: Average Feb. – Apr. temperature anomalies for years similar to 2024-2025 based on RONI. Darker blues represent cold anomalies. Darker reds represent warm anomalies (NOAA PSL and CIRES-CU).
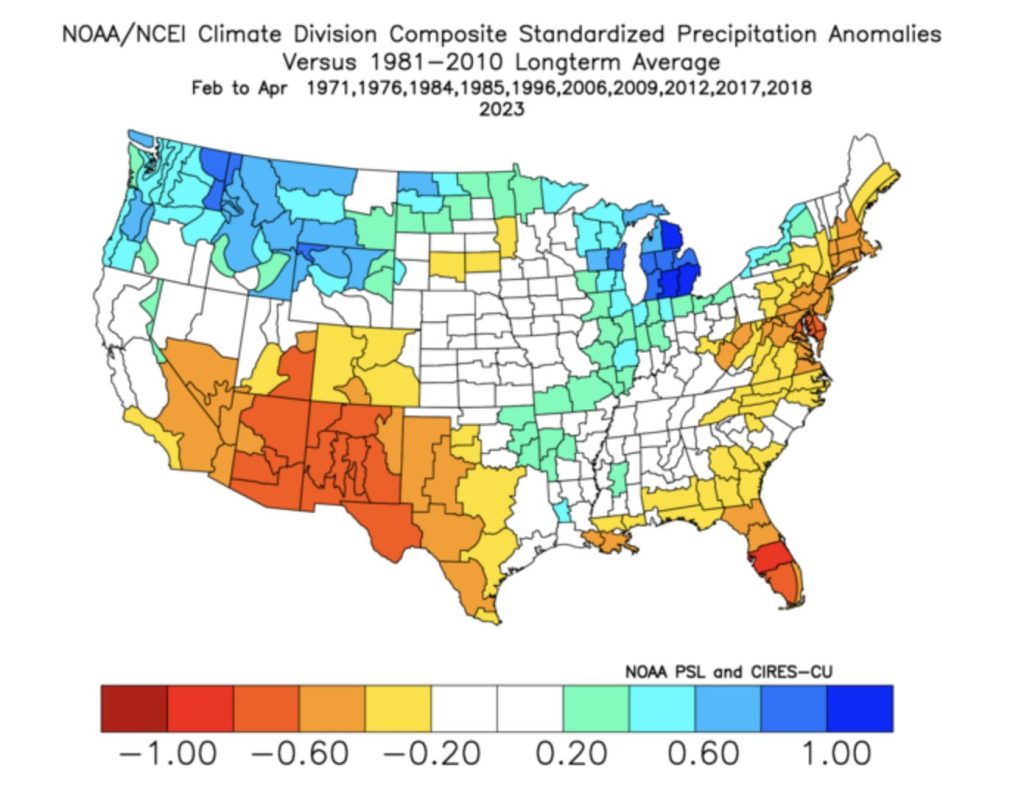 Figure 5: Average standardized/normalized Feb. – Apr. precipitation anomalies for years similar to 2024-2025 based on RONI. Darker blues represent wet anomalies, and darker reds represent dry anomalies (NOAA PSL and CIRES-CU).
These figures tell the story of a more typical La Niña response with a clear pattern of cooler than normal temperatures (Fig. 4) and a weaker tendency for wetter than normal conditions (Fig. 5). Impacts of ENSO events typically become harder to nail down as we move past the typical winter (Dec-Feb) season and into spring.
This method of choosing a few similar La Niña years to get a sense of how the rest of the wet season will pan out is admittedly not perfect. A more thorough analysis should include discussion of other determinants of our seasonal climate here in the Pacific Northwest. However, it is clear that a changing climate and rapid warming or fluctuations in SSTs complicates previous assumptions of El Niño/La Niña identification and necessitates an updated means of determining impacts on precipitation patterns.
For now, we are cautiously optimistic that we have good chances of a wetter pattern for the next few months given wetter-than-normal climate model outputs along with evidence of a stronger La Niña than the standard ONI suggests.
One thing is becoming abundantly clear this wet season: February will be a very important month to watch in determining our drought situation as we head into the dry season, especially given the precipitation deficits we have seen through January. Our more active pattern for the first few days of February has at least brought some temporary good news for snow lovers and hydrologic managers alike.
References:
L’Heureux, M. L., Tippett, M. K., Wheeler, M. C., Nguyen, H., Narsey, S., Johnson, N., Hu, Z.-Z., Watkins, A. B., Lucas, C., Ganter, C., Becker, E., Wang, W., & Liberto, T. D. (2024). A Relative Sea Surface Temperature Index for Classifying ENSO Events in a Changing Climate. J. Of Climate https://doi.org/10.1175/JCLI-D-23-0406.1
van Oldenborgh, G. J., Hendon, H., Stockdale, T., L’Heureux, M., Coughlan de Perez, E., Singh, R., & van Aalst, M. (2021). Defining El Niño indices in a warming climate. Environmental Research Letters, 16(4), 044003. https://doi.org/10.1088/1748-9326/abe9ed
Samset, B. H., Lund, M. T., Fuglestvedt, J. S., & Wilcox, L. J. (2024). 2023 temperatures reflect steady global warming and internal sea surface temperature variability. Communications Earth & Environment, 5(1), 1–8. https://doi.org/10.1038/s43247-024-01637-8