By Jacob Genuise
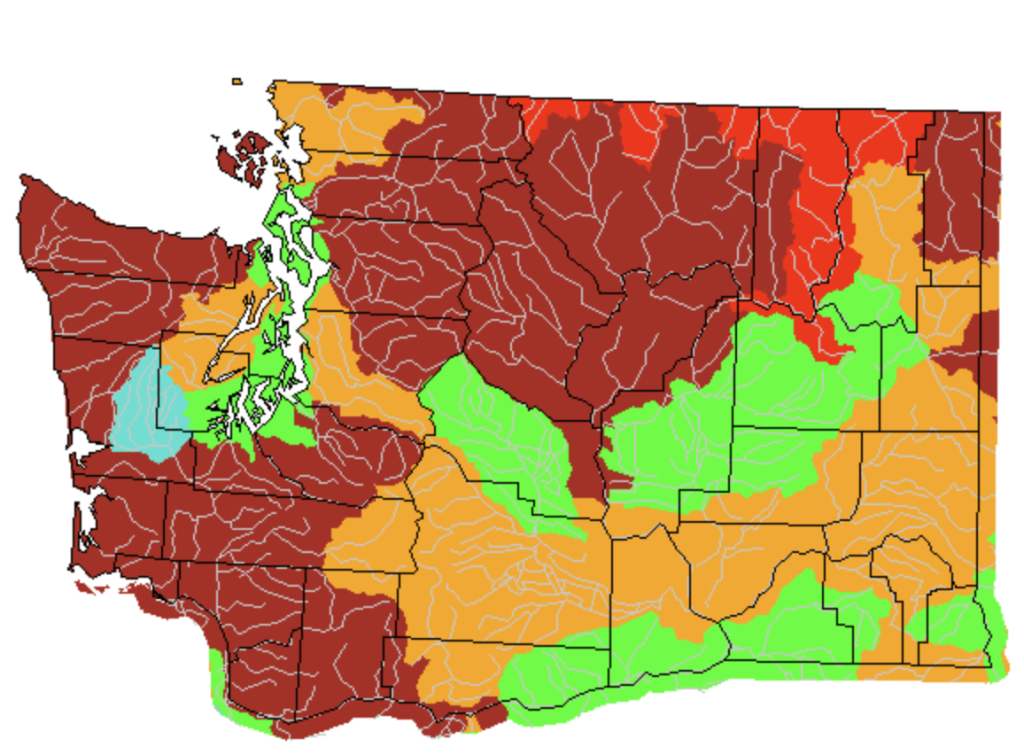 Streamflow percentile, by hydrologic unit, for July 2025. Data from USGS Water Watch.
Streamflow continues to run well below normal in July 2025. The majority of basins are experiencing below normal (orange) or much below normal (red) streamflow. A few basins in northern Washington are experiencing record low flow.
A 28-day graph of statewide runoff paints a similar picture of persistent and worsening hydrological drought this year. Statewide runoff has been below the 10th percentile since mid-May 2025. Furthermore, runoff has worsened and is running under the 5th percentile as of August 1. This means that for the past 28-day period, roughly 95% percent of years have seen more runoff than in 2025. Runoff is now approaching record lows as of early August.
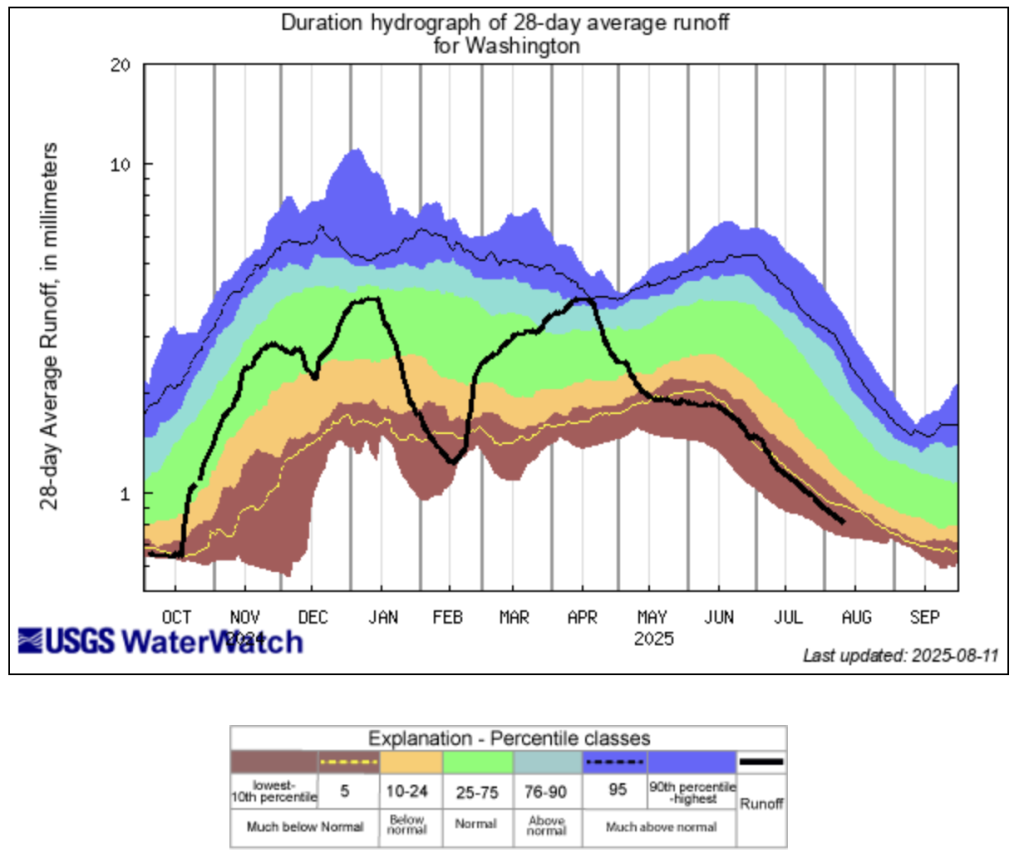 Water Year 2025 28-day average runoff statewide for Washington.
Driven largely by below average precipitation and snowpack over the past 4 months as well as warmer than normal temperatures, drought has continued to worsen and expand. The U.S. Drought Monitor introduced Extreme Drought (D3, red shading) over the northern and central Cascades for the first time this year, representing a continued escalation of drought concerns.
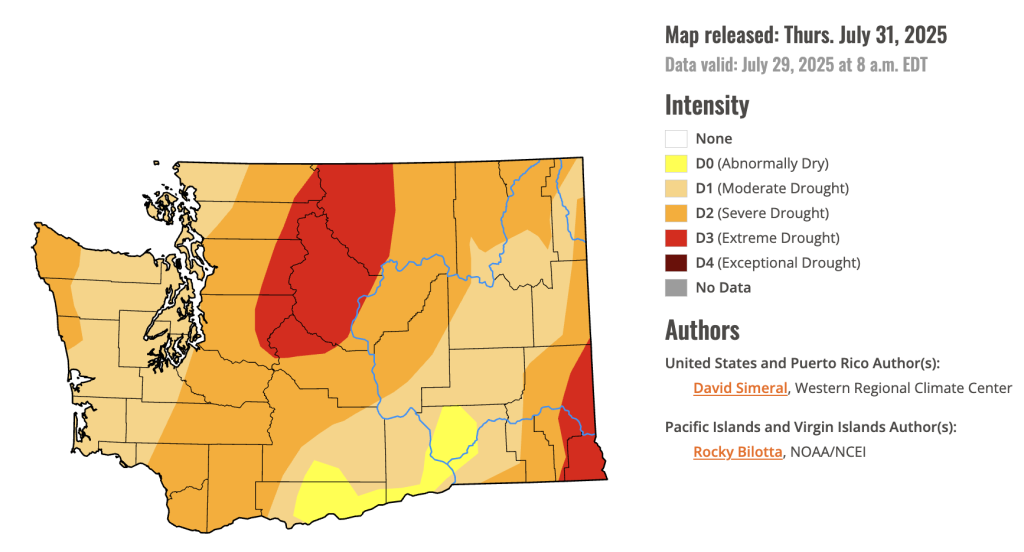 U.S. Drought Monitor for Washington. Data valid on July 29, 2025.
Extreme Drought now covers 14.4% of the state, the highest such percentage since the drought of 2021. Meanwhile, Severe (D2) and Moderate (D1) drought have also expanded to cover the vast majority of the state with only small portions of the lower Columbia Basin remaining at the lowest level of drought severity, shaded in yellow on the map above.
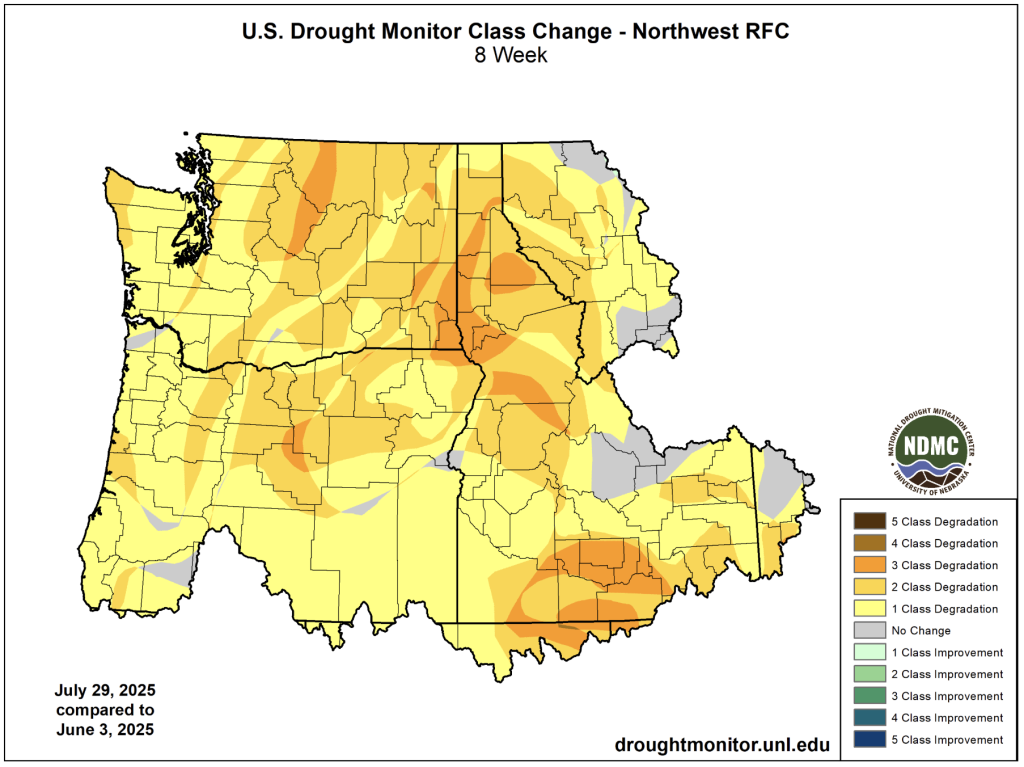 Change in U.S. Drought Monitor Class from June 3-July 29, 2025.
Zooming out to a more regional view, drought has worsened over the past 8 weeks for virtually the entire Pacific Northwest. On this map of change in U.S. Drought Monitor class, yellows and oranges represent worsening drought conditions, and darker oranges represent areas that have seen drought conditions worsen significantly since June 3, 2025. Rivers, soils, forests, and people are all feeling the strain of drought region-wide.