By Jacob Genuise
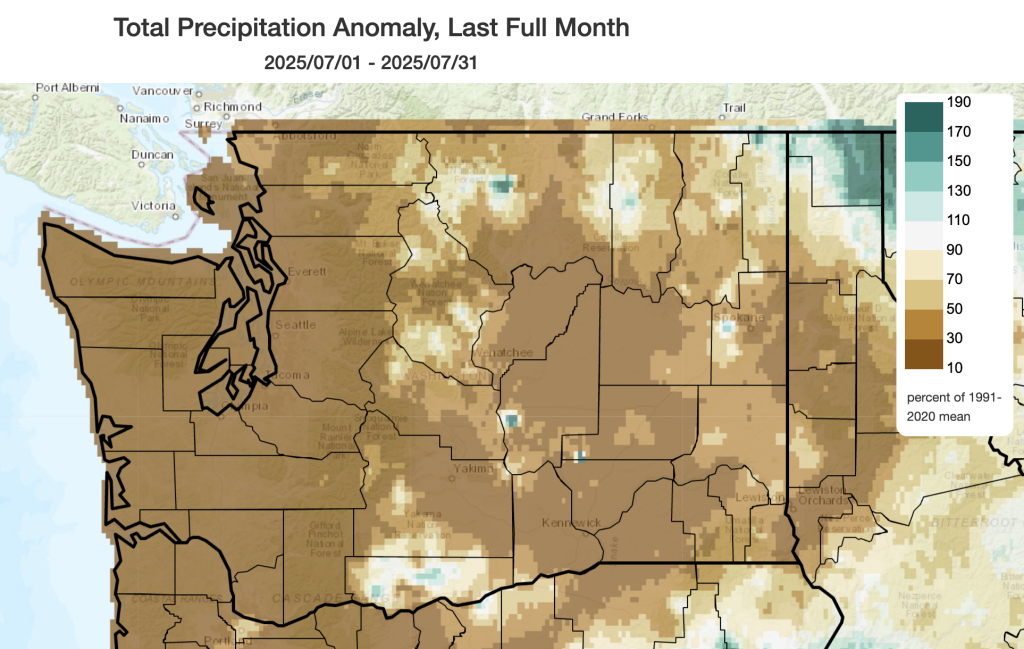 July precipitation as a percent of 1991-2020 normal.
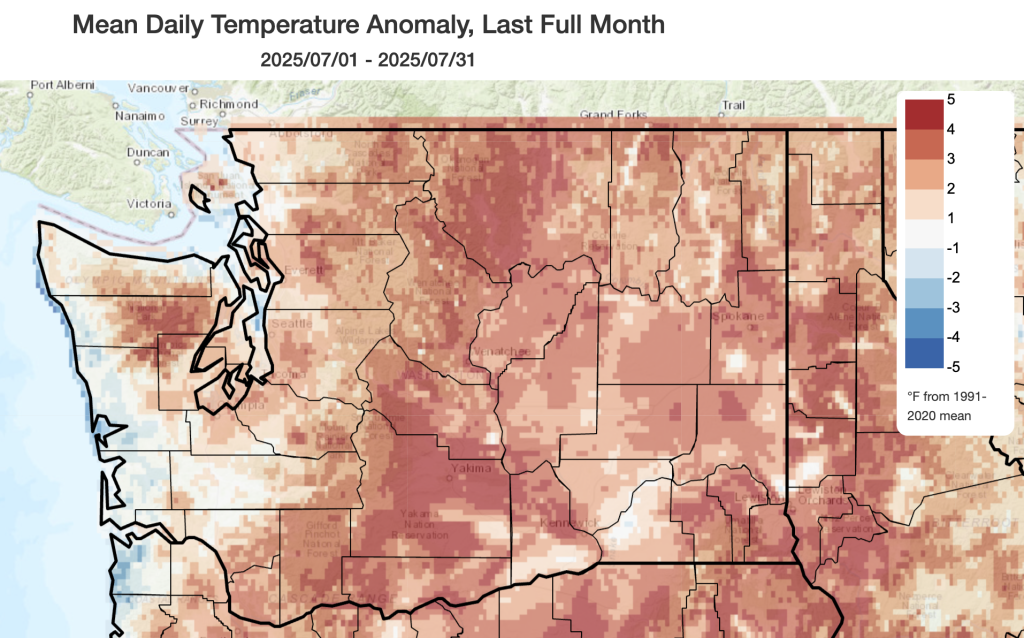 July mean temperature anomalies relative to 1991-2020 normal.
July was the fourth consecutive month with below normal precipitation statewide in Washington. Statewide, July 2025 was the 22nd driest month since 1895 with an average of only 0.27” of precipitation. Large portions of the state received less than 30% of normal precipitation including nearly all of western Washington and the central and southern Columbia Basin, as seen in the dark brown shading on the map above. Large portions of the I-5 urban corridor received either very little or no precipitation including just a trace of precipitation in both Olympia and the Seattle Weather Forecasting Office and 0.00” in Vancouver, WA for the month.
On the coast, Quillayute and Hoquiam received only 34% and 9% of their normal July precipitation, respectively. Crucially, key agricultural areas in the state including Yakima, Sunnyside, Prosser, and the Tri Cities also received well below normal precipitation. Dry conditions also occurred in Spokane (17% of normal), Ephrata (3% of normal), and Pasco (0% of normal) as well. The table below lists select stations where recorded precipitation fell within the top 10 driest July totals on record. Stations are listed in descending rank order.
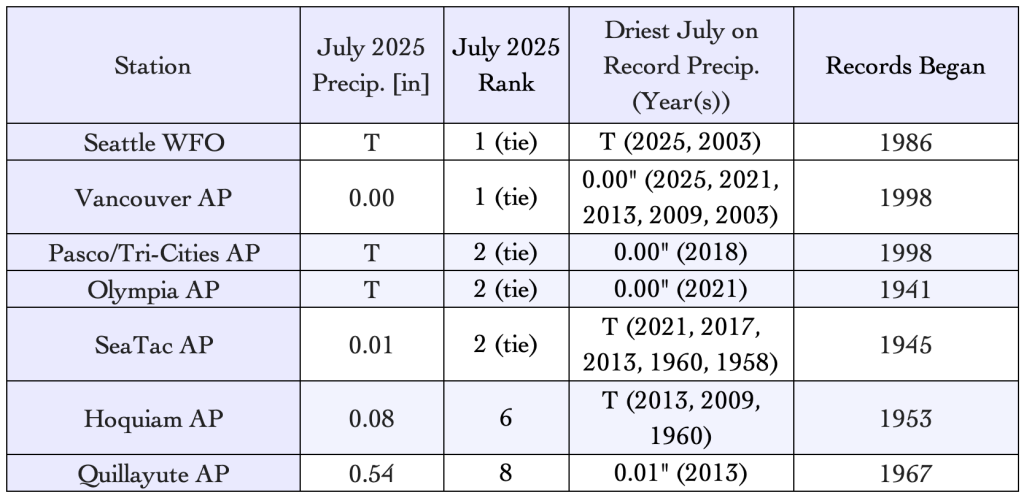 July 2025 precipitation rankings, in descending order, for select Washington stations.
Thunderstorm activity on the higher terrain of northeastern Washington and the Cascades brought scattered areas of near-normal precipitation along with a few very isolated pockets of above normal precipitation, as seen in the blue-greens on the map. These storms brought with them the threat of lightning and were much too isolated to improve the overall statewide drought situation.
Mean temperatures for July were well above normal statewide. Statewide, July 2025 was the 12th warmest July in Washington since 1895. Across much of western Washington, mean temperatures were around 1-3°F above normal including +2.2°F at Seattle WFO/NWS, +1.3°F at Olympia, and +1.7°F at Vancouver. Larger anomalies of about 3-5°F occurred in the Olympics. Eastern Washington experienced temperatures around 1-4°F above normal including +2.5°F at Spokane, +3.5°F at Wenatchee, and +1.9°F at Ephrata. Minimum or overnight temperatures were also particularly warm around the Yakima Valley with localized areas experiencing temperatures +5.0-7.0°F above normal. The only areas with just below or near normal temperatures in the state were along the Pacific Coast and shoreline of Puget Sound where cloud cover related to the marine layer tended to keep temperatures cooler than normal during the daytime.
 July 2025 climate summaries for locations around Washington. Anomalies are relative to a climate normal baseline of 1991-2020.
The scatterplot below shows how statewide precipitation totals and temperatures in May-June-July 2025 have compared to previous years. This can provide helpful context towards illustrating just how dry and warm late spring and early summer were this year. The dark red circle on the scatterplot represents this year, and each separate point represents each year’s May-July period, with data back to 1979. The lefthand axis of the chart shows precipitation, and the bottom axis shows temperature. The May-July 2025 period has been the 4th driest such period since 1895.
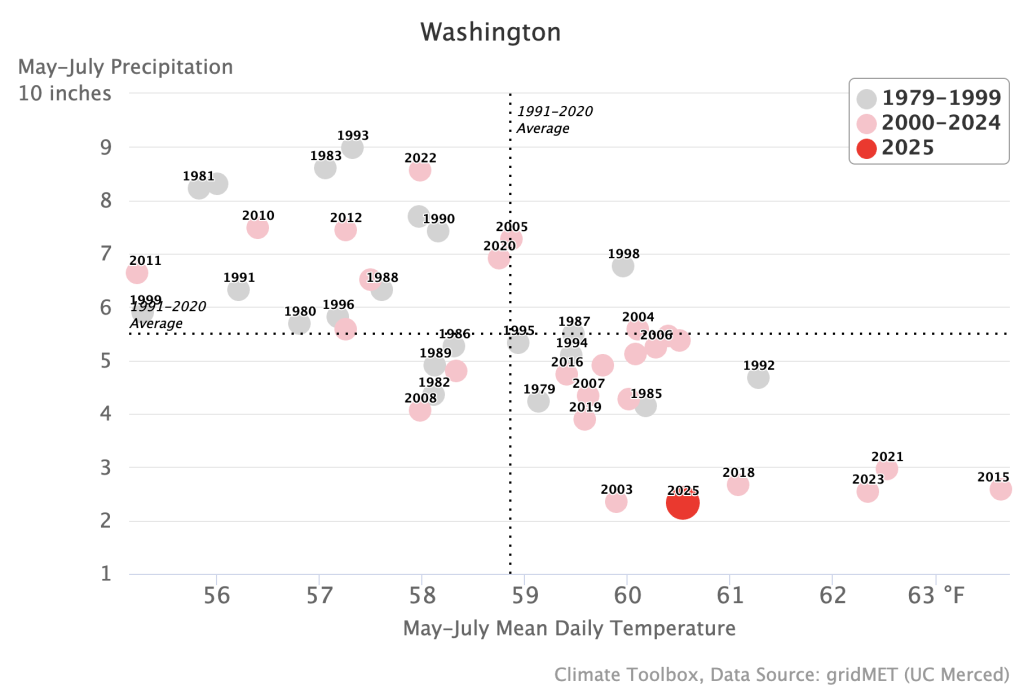 Washington statewide average precipitation (y-axis) and mean daily temperature (x-axis) for May-July for 1979-2025. The dark red dot denotes 2025 values.