By Nick Bond
As presented previously in this newsletter, filling the gap between deterministic weather forecasts out about 10 days and probabilistic predictions on seasonal (multi-month) time scales is an active area of research for the meteorological community. Information on these time scales is useful, of course, for a range of health, infrastructure, and natural resource managers, among others. OWSC considers 3-4 week forecast information in our briefings to the state’s Water Supply Availability Committee (WSAC), for example, to try to anticipate general weather patterns on the horizon. Specifically, since the summer of 2016, we have been presenting 500 hPa geopotential height (Z) anomaly maps for week-3 and week-4 from NOAA’s CFSv2 seasonal climate prediction model as a part of these briefings.
But are the forecasts any good? Previous research (e.g., Weber and Mass 2019) has considered this question, and reveals that a proper account of tropical convection is crucial. Given the CFSv2 model’s struggles in handling tropical convection, we thought it might be interesting to carry out a quick, semi-quantitative look at the quality of the operational product for WA.
This analysis is far from definitive, as we based our results on the CFSv2 maps presented during 19 past meetings of the WSAC. This totals 38 500- hPa Z forecasts (19 week-3 and 19 week-4); the forecasts represent ensemble means from 16 model runs from an initial data (available: https://origin.cpc.ncep.noaa.gov/products/people/mchen/CFSv2FCST/weekly/). For this mini-analysis, we binned the 500-hPa Z mean anomalies over WA state into 3 categories: below normal, near-normal, and above normal. We repeated that process for both the implied 500 hPa zonal wind (U) and 500 hPa meridional wind (V). For the mean Z, U, and V, we counted up the hits, 1-category errors, and bad misses (2-category errors) in our admittedly small sample of CFSv2 forecasts, using weekly averages from the NCEP Reanalysis as verification. Using Z as an example, a “hit” is one in which the category of the forecasted anomalies matches the verification. A 1-category error is when the direction of the forecast is off by 1 category; for example, a near-normal forecast turns out to have negative heights in reality or a positive height anomaly forecast is actually near- normal. A 2-category error (i.e., a “bad miss”) is just as it sounds: a positive height anomaly forecast is actually negative in reality and vice versa.
Figure 1 shows an example of a relatively good forecast from earlier this year (22 Jan 2020). The forecast for the northern hemisphere as a whole is quite similar to the verification in this example; there were others that are comparable or even better in terms of their predictions for the Pacific Northwest. On the other hand, Figure 2 shows an example of a “bad miss” forecast. The forecast made on 31 Jan 2018 for the latter part of February 2018 in this example shows how a CFSv2 forecast can bear little relation to what actually occurs on the 3-4 week time horizon.
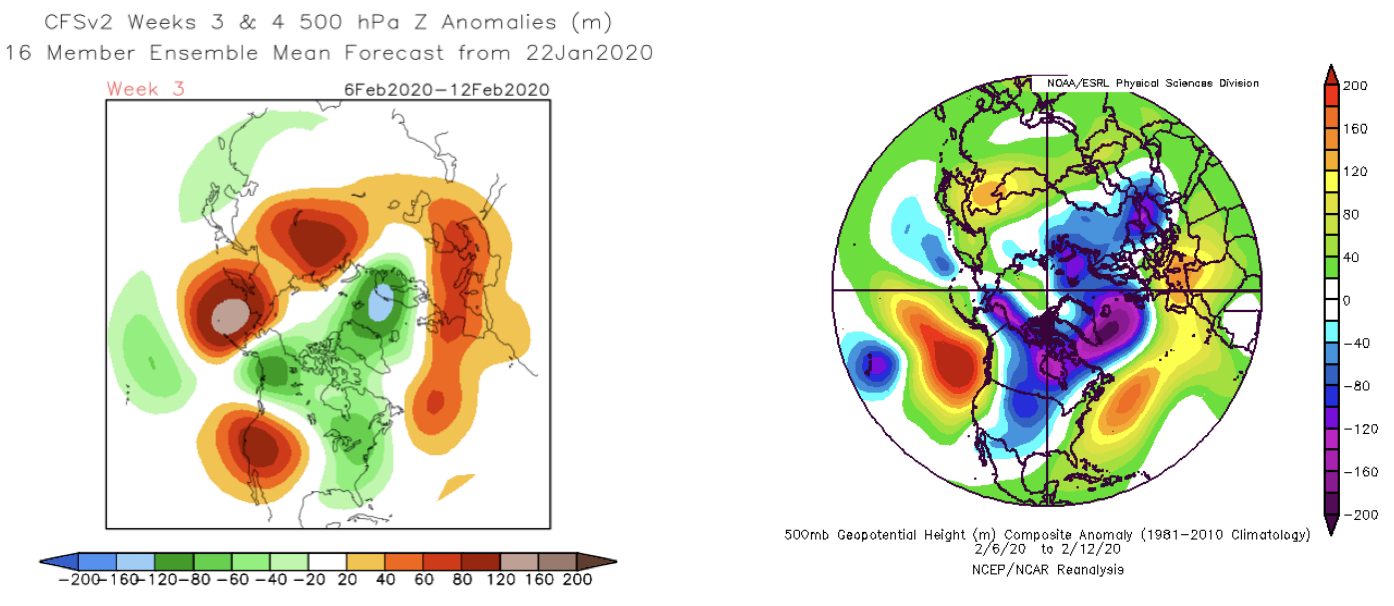 Figure 1: An example of the CFSv2 forecast initialized on 22 January 2020 for 6-12 February (left) and the verification (from ESRL; right) that was a “hit”. The week-4 forecast from this same initialization also verified (not shown).
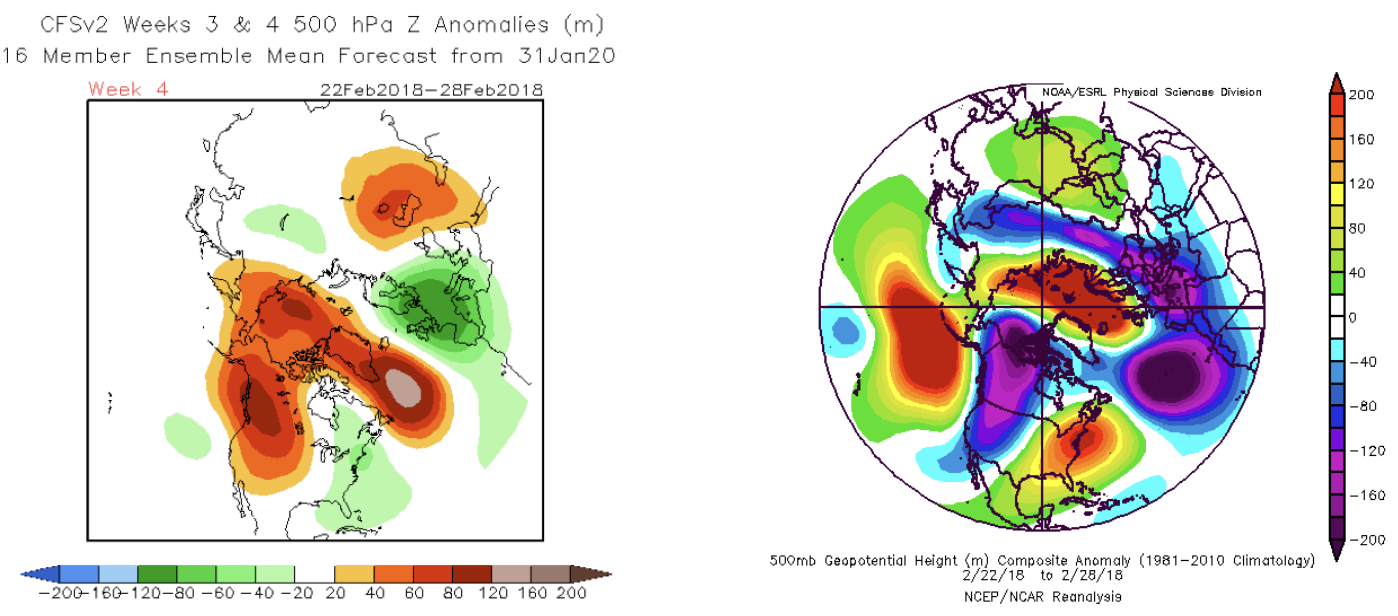 Figure 2: An example of the CFSv2 forecast initialized on 31 January 2018 for 22-28 February (left) and the verification (from ESRL; right) that was a “bad miss”.
The summarized results for each of the 38 cases are shown in Table 1. As shown, there are just a few more “hits” than would be expected by chance, assuming each of the 3 categories is equally likely. In terms of 1-category errors, there was almost exactly the number that would be expected if the verifications were picked at random. The better news for forecast accuracy is that there were fewer 2-category errors than by chance, especially with regards to 500 hPa U wind anomalies. We did not formally separate out warm season from cool season anomalies due to the small sample size but our qualitative impression is that there is not that much difference.
 Table 1: The forecast hits, category 1 errors, and category 2 errors tabulated for the CFSv2 geopotential heights (Z), implied zonal wind (U), and implied meridional wind (V) forecasts compared to NCEP/NCAR Reanalysis verification.
We have not considered whether the strongest anomaly forecasts verify any differently, and that would be difficult to conclude with such a small sample size. What might be more meaningful for verifying these forecasts would be to consider the consistency of the CFSv2 forecasts – are they changing from day-to-day and hence is it presumably a less predictable period or does a particular daily forecast closely resemble those for the past few days? If there is daily consistency in the 3-4 week forecasts than it’s conceivable that those forecasts are more reliable. That sort of analysis is beyond the scope of the present treatment, however. The take home message from this analysis is that category 2 errors are rare, but we can expect most of the forecasts presented at the WSAC to be either hits or off by one category. In other words, we will continue to look and consider this CFSv2 product, but we are not betting the farm on it!
Reference
Weber, N.J., and C.F. Mass (2019): Subseasonal weather prediction in a global convection-permitting model. Bull. Amer. Meteor. Soc., 100, 1079-1089, doi:10.1175/ BAMS-D-18-0210.1