By Nick Bond
Based not just on my own perceptions, arguably of dubious trustworthiness, but also conversations with long-time residents of WA state, I have the sense that it is not as frequently foggy during early fall as it was in the past. This time of year is relatively favorable for the formation of low visibilities. Calm and clear conditions occur regularly, and the nights are long enough for radiative cooling to lower surface temperatures to the dewpoint, resulting in fog and low-level stratus that can persist well into the following day. But there are reasons why that may not be occurring as often. With increasing concentrations of greenhouse gases, the downward longwave radiative fluxes are also increasing; in general we are experiencing especially robust upward trends in minimum temperatures. Water vapor is a potent greenhouse gas, and hence trends in this constituent play a role here, and sometimes a prominent one. We surmise that is the case regionally in that the NCEP Reanalysis indicates a rise of about 10% over the last 50 years in precipitable water (vertically integrated water vapor content) for WA state during the month of October. A more humid atmosphere generally means less cooling at night. But if much of that additional water vapor is at low levels, perhaps higher dewpoints mean it does not require as much cooling for late night/early morning temperatures to dip down enough to produce fog. Therefore, it is worth taking a look at what actual visibility observations are telling us.
The cli-MATE application maintained by the Midwestern Regional Climate Center (MRCC) was used to assess the frequency the fog in past years at various locations in WA state. More specifically, the “Frequency Distribution” option in the “Hourly Observed Data” section was used to determine the frequency of hours with visibilities less than 1 mile during the month of October, with statistics compiled separately for the years of 1972 through 1992, and the years of 2002 through 2022. These two periods were chosen arbitrarily to be far enough apart to reveal a potential signal, but also include a sufficient number of years to minimize the effects of interannual variability. This method neglects to account for any changes in observation practices. Formerly, visibilities were estimated by human observers at hourly intervals, with supplemental reports when conditions changed significantly between the standard observations. Landmarks, or known light sources at night, specific to a particular station formed the basis for estimating visible ranges. Presently, visibilities are determined continuously by unattended instruments through the scattering of light in small volumes of air passing between a source and a sensor. The transition from human to automatic observations occurred mostly in the late 1990s, and hence the two periods considered here are different from measurement perspectives. We examined counts of low visibility hours for the years around this change, and did not notice sudden and obvious changes in the frequency of low visibilities (not shown). Given the above caveat(s), we forge ahead.
The average frequency of hours with visibilities less than 1 mile for the early period of 1972 through 1992 and the late period of 2002 through 2022 at 6 stations in WA state is summarized in Table 1.
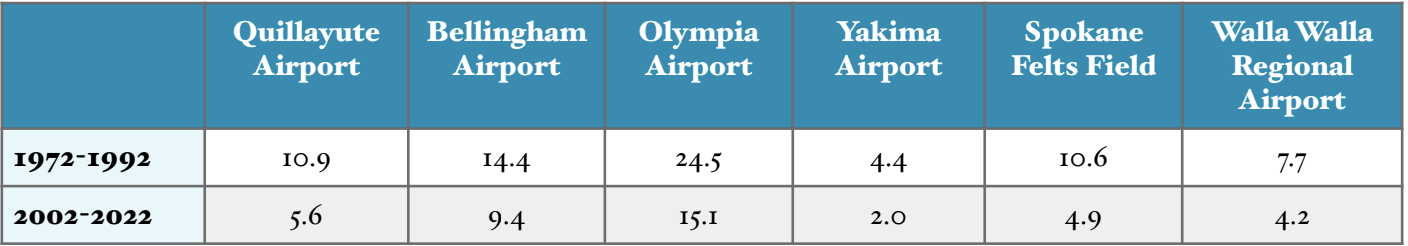 Table 1: The frequency of reports (%) with horizontal visibilities less than 1 mile for 1972-1992 and 2002-2022. Note: Felts Field is near the Spokane River, and at an elevation about 400 feet lower than Spokane International Airport. It was selected because it may be a relatively foggy spot for that part of the state.
All six stations that were queried featured substantial decreases in the frequency of low visibilities. Conceivably the human observers were sensitive to periods of visibilities less than 1 mile, i.e, in the low instrument flight rules (LIFR)category, and those conditions were preferentially reported in the earlier period. But there is another reason aside from climate change that might account for at least part of the drop-off. For the Central Valley of California, Gray et al. (2019)documented a 76% decline in the frequency of fog from 1980 to 2016 and attributed this decrease to pollution controls resulting in steadily lower NOx emissions, and ultimately fewer cloud condensation nuclei (CCN) for fog formation. They found that the dew point depression, which is akin to the relative humidity, influenced year-to- year fluctuations in fog frequency but did not explain the overall trend. Motivated by the idea of changing aerosol concentrations, we carried out our own quick and dirty analysis of humidity trends. More specifically, and again using hourly data from cli-MATE, we tabulated the number of hours with reports of the relative humidity exceeding 95% that also lacked measurable precipitation (the latter criterion was aimed at excluding periods of heavier rain), using Bellingham and Spokane (KSFF) as crash-test dummies. The counts for those two stations for the October months of 1972 through 2022 are shown in Figure 1. Those two stations suggest that the relative humidity approaches 100% more rarely in October since the turn of the century than previously, with Bellingham showing an especially dramatic drop.
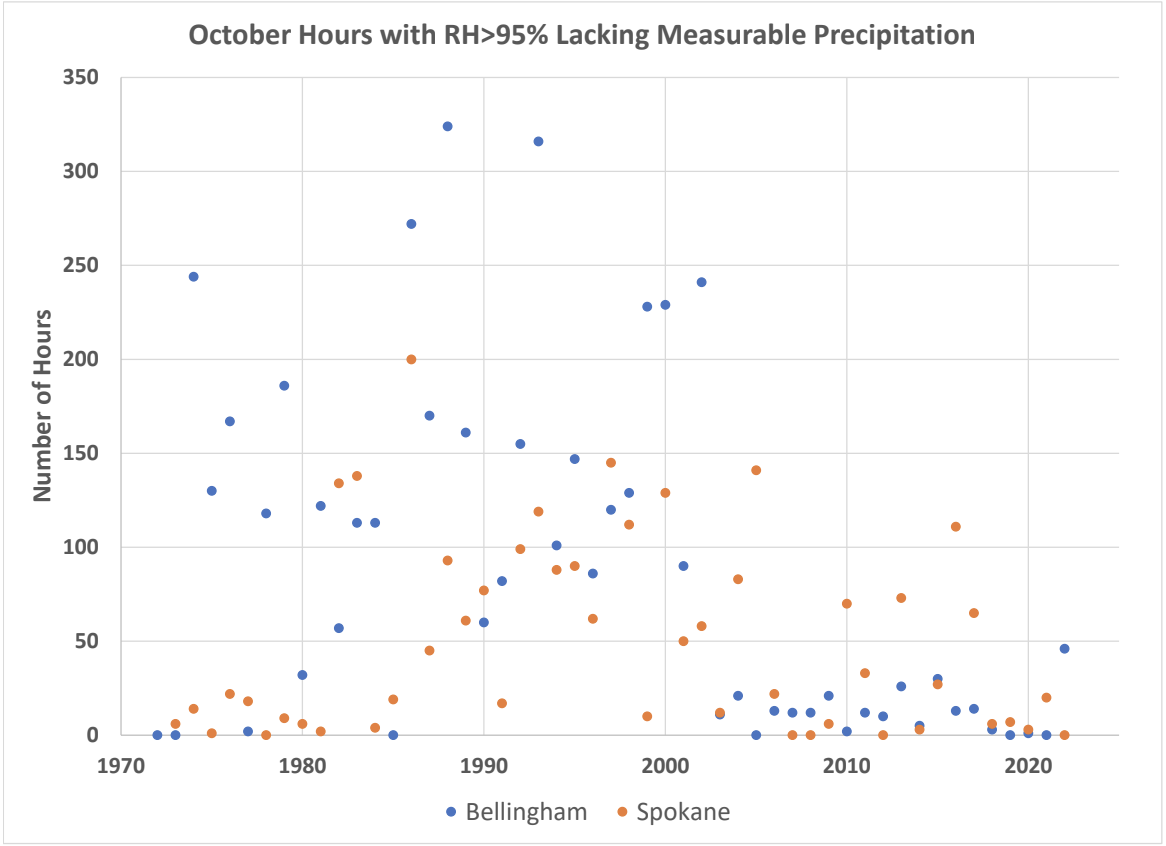 Figure 1: The number of October hours per year (1972-2022) with relative humidity exceeding 95% without measurable precipitation for Bellingham (blue) and Spokane Felts Field (orange).
In summary, there are indications, if not definitive proof, that indeed it has tended to be less foggy in WA state during the month of October over the last couple of decades compared with the late 1900s. Our treatment here is too superficial to establish the primary cause(s), but it does appear that near-saturated conditions also occur less frequently, at least at a couple of places we checked. While fewer fogs are good news for aviation and road safety, we sympathize with all those that are now hampered in their reenactments of the climactic scene from “The Hound of the Baskervilles”.