By Jacob Genuise
There are a truly dizzying number of ways to measure the start of spring: Is it when lilacs start blooming and grapevines begin to leaf out? Or is it that first warm day of the season when local parks fill up? Is it when the threat of frost has passed and the soil warms enough to plant summer crops? Or is it the steady retreat of the rainy season, replaced by sunnier days? One could make a perfectly acceptable argument for using any number of these metrics.
Farmers, and home gardeners across the state watch frost dates closely, so the date of the last spring frost seems like a good place to start. McCabe et al. (2015) observed a consistent trend toward an earlier start to our frost-free growing season across the United States, most notably since the early 1980s. They also noted an overall lengthening of the frost free growing season at most stations nationwide. Another harbinger of spring and warmer weather is the first warm day of the year.
Let’s take a look at how these dates are trending across Washington state. Specifically, we’ll look at trends in the average date of last frost and the first 75°F day of the year at 12 long-term stations across Washington State from 1960-2024. These stations were chosen because they have long periods of record as well as regular maintenance and quality control.
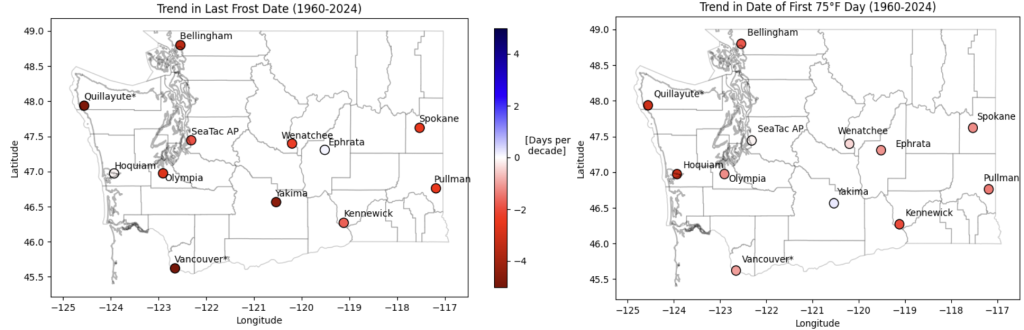 Trend in last frost date (left) and trend in date of first 75°F high temperature of the year from 1960-2024. Shading indicates change per decade, in days, with reds representing a trend toward earlier onset of spring.
These maps show an earlier spring onset at most stations– i.e.: trends toward both earlier last frost and earlier first 75°F days (shaded in red). It should be noted that none of these trends were significant to the 95% confidence interval, but the consistency of the trend across space does provide good evidence of earlier spring onset.
Us climatologists cannot seem to get enough maps in our lives, but here is this same information summarized in a graph for those who are not as excited about maps. Again, it is clear that most stations show a trend toward earlier spring onset due to the dates of the last frost and the first 75°F day occurring earlier in the year, as shown here in the red shaded region. Quillayute has the largest trends, with last frost dates occurring almost a month earlier and their first 75°F day occurring about three weeks earlier compared to the 1960s and 70s.
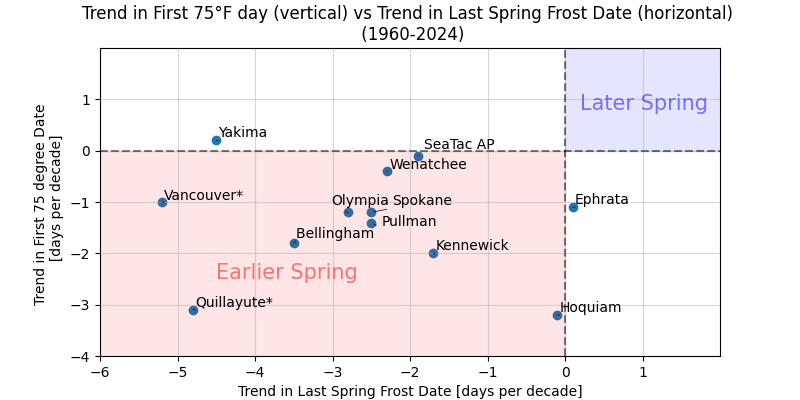 Trend in date of first 75°F day (y-axis) and trend in last spring frost date (x-axis) for the same stations represented in the maps above.
*Vancouver and Quillayute have shorter periods of record (1997-2024 and 1967-2024, respectively).
A few stations such as Yakima and Ephrata have inconsistent trends in these metrics, suggesting there are some other factors at play here such as station siting, complex microclimates, and possibly human influence from irrigation, urbanization, or other factors. Of course these are also limited metrics to define spring, and a more holistic analysis would likely take into account phenological factors (i.e. timing of biological seasonal processes such as leaf out or end of hibernation), precipitation, as well as soil temperatures and growing degree days, but these two temperature thresholds provide a glimpse into earlier spring timing across our state.
Now let’s shift gears a bit and get a sense of what the average last frost dates and first 75°F degree dates are for these stations. Below is a table of mean last frost dates and mean first 75°F dates for these stations, sorted by last frost date. Note: These values are calculated from the station’s entire period of record, some of which including Spokane and Kennewick extend back to the late 19th century, well before the 1960 start date we used in our trend analysis.
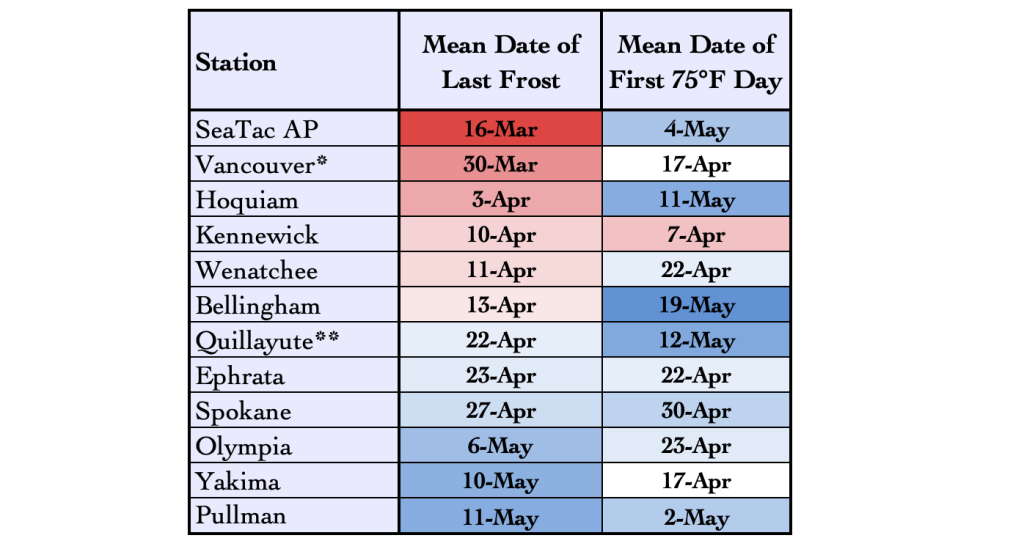 Mean date of last frost and mean date of first 75°F day for the same stations as above, sorted by last frost date. Reds represent earlier dates and blues represent later dates. Shading transitions between red and blue around April 17th, where white values are shown.
* Vancouver record length: 1997-2024
** Quillayute record length: 1967-2024 All other stations have periods of record at least back to 1960, with some (Kennewick and Spokane) extending back to the late 19th century.
If you guessed that our varied geography and elevation across the state might lead to large differences in these dates, you’d be spot on! Paying attention first to the left hand column, last frost dates vary from March 16th at SeaTac Airport, a known warm spot in terms of cool-season minimum temperatures in the Puget Sound lowlands, to May 11th in Pullman. Pullman’s late spring frosts are thanks largely to its higher elevation and exposure to colder spring air masses barreling down the Rockies and the interior west. Yakima also has a similarly late frost (May 10th) despite being nearly 1,300 feet lower in elevation and much further west than Pullman. This is largely due to the Yakima Valley’s impressive ability to trap cold air as it drains off of the Cascades and surrounding valley ridges on clear spring nights.
Generally, stations with more of a marine influence (Hoquiam, Seattle, and Bellingham) have earlier last frost dates while more continental stations in eastern Washington are more prone to late-spring frosts. It is striking how much later the last frost tends to occur in Quillayute, which is located just a couple of miles inland as compared with the Hoquiam weather station at Bowerman Airport, which is on a spit extending into an estuarine bay (Grays Harbor).
The story gets a bit more complex when we take a look at the column on the right showing the mean date of the first 75°F day. Kennewick/Tri Cities kick off spring in Washington first with a first 75°F day around April 7th. This is due to their low elevation (around 400 feet) in the typical heat belt of the lower Columbia River Basin.
But why is there such an early last frost date at SeaTac AP (March 16th) compared to Olympia (May 6th) when these stations are not very far apart? What about Yakima: Why does it have the same mean first 75°F date as Vancouver, WA (April 17th), but widely different last frost dates (May 10th and March 30th respectively).
These are great examples of just how varied and localized climate can be. Take the case of SeaTac and Olympia. Olympia typically sees its first 75°F day a bit earlier than SeaTac (April 23rd vs. May 4th, respectively) largely because Olympia has a more continental climate (because it’s to the south, it’s more sheltered from Puget Sound) and therefore tends to warm more quickly during fair weather. SeaTac is more often influenced by the cool waters of Puget Sound. As for last frost dates, Olympia is also notorious for frost as cool air settles into the Nisqually Delta and surrounding lowlands on clear nights. This leads to much more frequent and severe winter freezes, and later spring frosts, compared to areas further north along the Sound.
What about Yakima and Vancouver, WA? Why do they have a similar first 75°F date but very different last frost dates? As noted earlier, Yakima is prone to pooling cold air in the Yakima Valley, hence the late last frost (May 10th). In prolific agricultural areas such as the Yakima Valley, late spring frosts can have large economic impacts due to frost damage. In contrast, Vancouver does not sit in such a constrained valley, it is at a lower elevation, a more southerly latitude, and it can be subject to influences by the Greater Portland Metro heat island and close proximity to the Columbia River. All of these factors tend to limit nighttime cooling and put an early end to spring frosts around March 30th, on average. Next time you are walking around your neighborhood or driving across our state in the early morning following a clear night, I encourage you to pay attention to the temperatures in sheltered valleys compared to breezier ridges. You might be shocked at how much the temperature can vary over relatively short distances.
As for the timing of spring, we expect this trend toward earlier springs in the coming decades to continue, of course with plenty of interannual variability. This presents an opportunity for earlier garden planting and longer growing seasons, but it may also result in longer periods of water demand, likely increasing drought concerns later in the growing season. Shifts in the timing of the seasons from a weather perspective are just one of the many indicators of our changing climate that we will be watching closely over the coming decades.
Reference:
McCabe, G. J., Betancourt, J. L., & Feng, S. (2015). Variability in the start, end, and length of
frost-free periods across the conterminous United States during the past century. International
Journal of Climatology, 35(15), 4673–4680. https://doi.org/10.1002/joc.4315