By Jacob Genuise
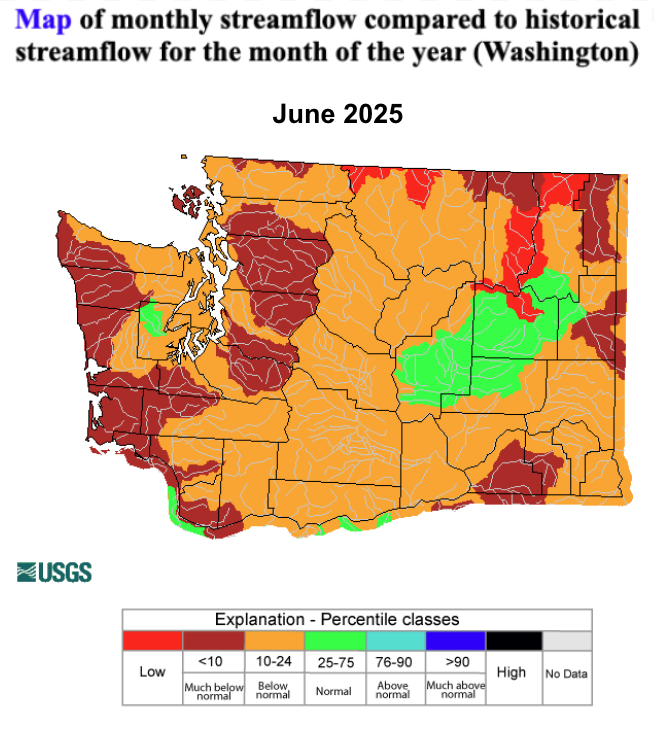 Streamflow percentile, by hydrologic unit, for June 2025.
Warm and very dry conditions in June 2025 contributed to worsening drought conditions and declining streamflow statewide. June streamflow has dropped below normal as indicated on the monthly streamflow percentile map, courtesy of the USGS Water Watch. Almost all basins have below normal flow, and many across western Washington and the Cascades are now in the “much below normal” category. This means 10% or fewer years have seen lower streamflow during June in these basins. Streamflow is also much below normal across northeastern Washington, far eastern Washington, and in the Blue Mountains, with some record lows recorded in June near the Canadian border.
The low June streamflow across the state is primarily caused by below normal precipitation over the last several months as well as earlier-than-usual snowmelt due to above normal temperatures. A map of precipitation percentiles over the last 3 months from April 1-June 30, 2025 reveals that the majority of the state is experiencing record low precipitation (dark brown shading on the map). This includes virtually all of the Cascades, the Chehalis River Basin, northeastern Washington, and southeastern Washington toward Walla Walla and Pullman. All areas of the state received below normal precipitation over the last 3 months, and the majority of the state has received record low precipitation.
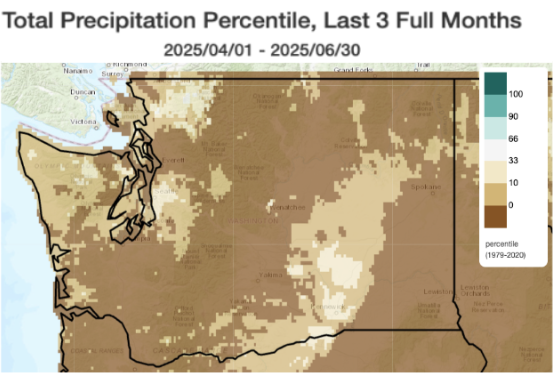 Precipitation percentile from April 1 -June 30, 2025. Dark browns demonstrate drier conditions.
This historically low precipitation has also contributed to below normal water supply forecasts, according to the Northwest River Forecast Center NWRFC. The latest forecast for April-September shows below normal streamflow for all forecast points across the state with the majority of points around 60-75 percent of normal. These forecasts are based on natural flow, and are calculated independent from reservoir releases or other human-made diversions. Reservoir levels are also declining more quickly than normal given warm and dry conditions driving high irrigation demand. The Yakima River Basin’s total reservoir storage peaked below last year’s storage and is well below normal.
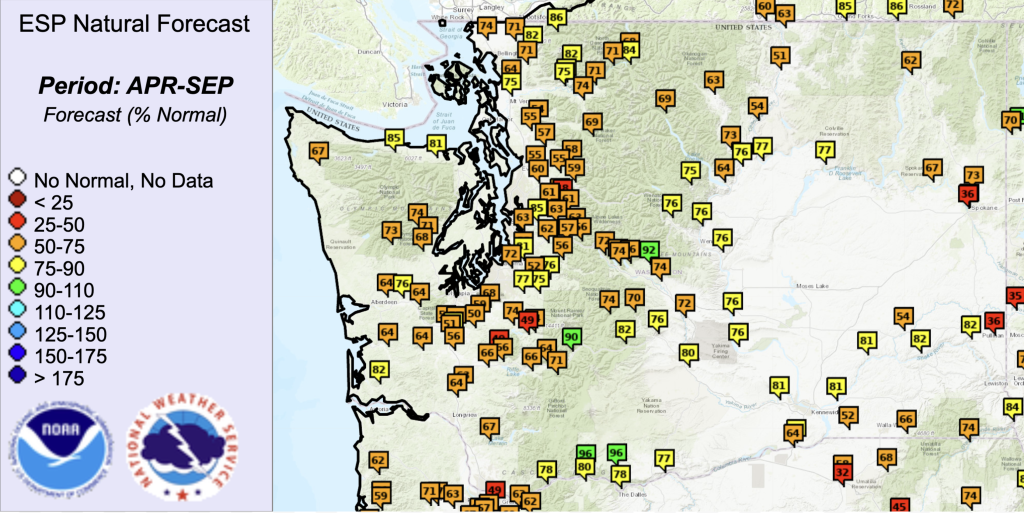 NWRFC water supply forecast for April-September 2025, percent of normal.
According to the U.S. Drought Monitor, Severe Drought (D2) has appeared for the first time this year in Washington. Severe drought now encompasses the central and northern Cascades as well as far southeastern Washington. Moderate Drought (D1) conditions have expanded into Okanogan, Chelan, Douglas, Grant, Kittitas counties. Over the past month alone, the northeastern slopes of the Cascades and parts of far eastern Washington near Spokane down through Pullman have gone from D0 (Abnormally dry) to D2 (Severe drought) — a major degradation.
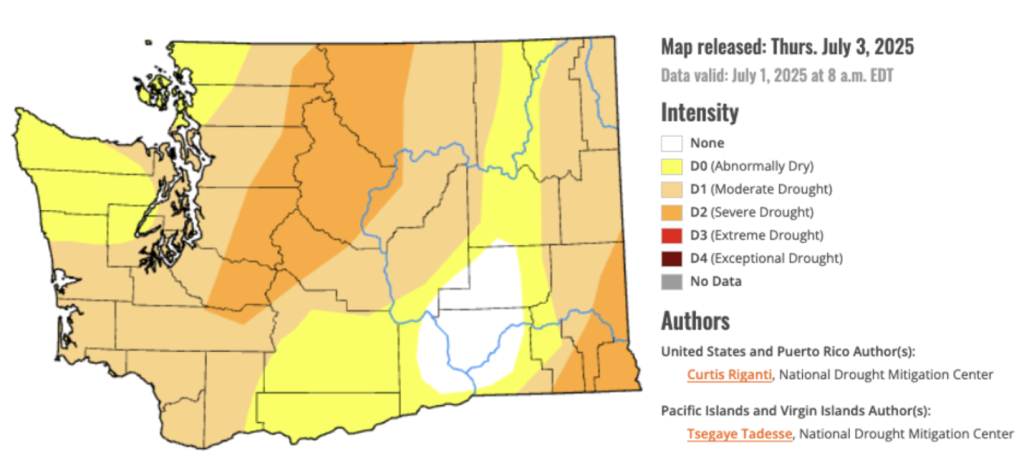 U.S. Drought Monitor for Washington valid on July 1, 2025.