By Jacob Genuise
Winter Recap: Snowpack Near Record Lows Following Warm Winter
Conditions this winter were quite remarkable. Statewide, November through March was the second warmest such period since at least 1895, surpassed only by the exceptionally mild winter of 2014-2015. January and February, two of the most important months for building snowpack, were also the 19th driest on record, but warm temperatures were the main driver of this year’s snow drought.
Our peak snowpack was only around one-half of normal. Too much of our winter precipitation fell as rain rather than snow, meaning that we had less stored in our snowpack at the end of the winter season. Read more about the current state of snowpack in our April Snowpack and Drought Summary. River flows in most snowpack-fed rivers have been running near or above normal this spring as the snow melts, helping operators to fill reservoirs across the state. Nevertheless, dry weather over the past few weeks has caused lower elevation, rain-fed rivers to begin to run below normal, and basins where snow has already melted out are beginning to experience decreased streamflows as well.
Reservoir Capacity
You may be wondering, can’t we just rely on our currently-full reservoirs to meet irrigation demand this summer? It is true that many reservoirs are currently at above normal levels.
However, there is a limit to what reservoirs can hold, and reservoirs alone do not come close to meeting all of the demand in Washington state. Snowmelt remains a critical aspect of our water supply in all basins, even when we begin the dry season with full reservoirs.
Let’s focus in on the Yakima River Basin (YRB) as an example, largely because it is a key agricultural region representing roughly 450,000 irrigated acres, or about 25% of Washington’s nearly two million total irrigated acres of agricultural land. Although the nearby Columbia Basin Project downstream on the Columbia River serves more total irrigated acreage (671,000 total irrigated acres) than the YRB, the YRB is home to some of the highest value specialty crops in the state and represents around $4.5 billion dollars in agricultural value (as of 2018). Acre-for-acre, economic output in the YRB is among the highest in the state.
This region is also particularly prone to water supply issues in part because the basin’s water demand far outpaces its reservoir storage capacity, as illustrated by the pie chart included here which shows the total water demand in the Yakima Basin.
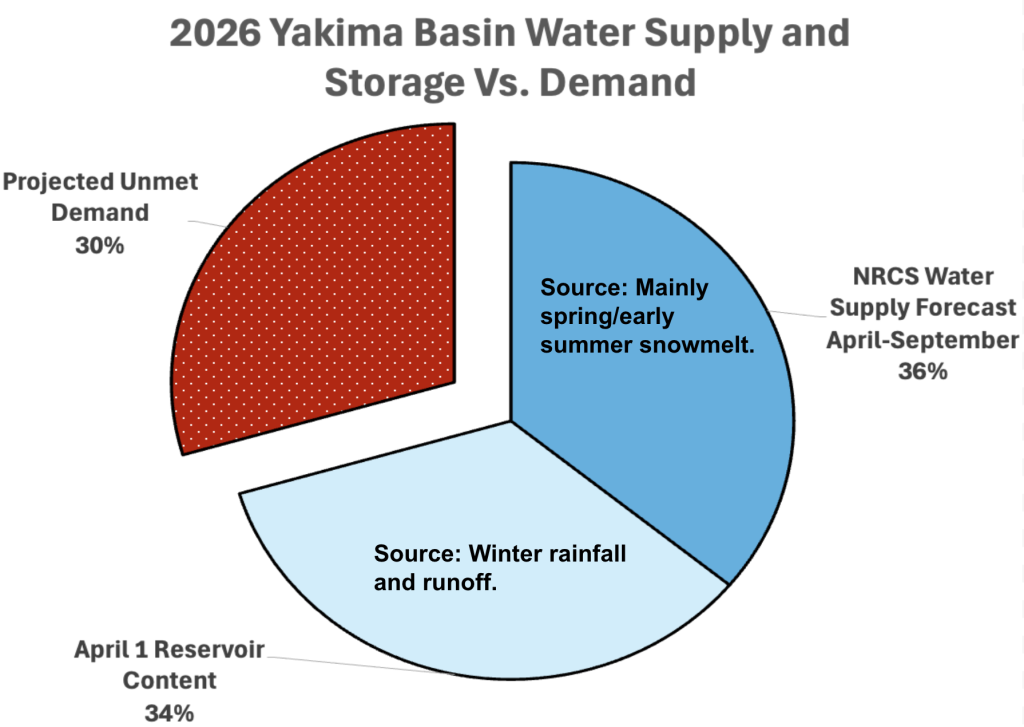 Yakima Basin approximate water supply versus demand. Credit: US Bureau of Reclamation and the Northwest River Forecast Center.
In a typical year, YRB demand is met via two main water resources: (1) April 1 Reservoir Content (light blue) and (2) April-September flow from snowmelt, rainfall, and groundwater (darker blue).
This year the reservoirs have been full or nearly full since late-March. However, even at capacity, the Yakima basin reservoirs can only provide around one-third of the total demand in the basin. That leaves natural water sources to make up the other two-thirds of total demand – primarily via snowmelt.
This year, forecasts from the Bureau of Reclamation made in early April estimated that natural water sources will only provide about 36% of total demand for April-September. This leaves about 30% of total demand unmet in the watershed. This is largely due to low snowpack. As of May 7, the Upper Yakima Basin only had about 1.6” of snow water equivalent (SWE) this year, compared to 18” in a normal year. The Naches basin is similar: it had 9.6” of SWE, compared to 35” in a normal year.
The junior water users will feel the brunt of this water supply deficit. On May 7, the US Bureau of Reclamation released their latest total water supply availability forecast, indicating that the junior water users will only receive 52% of their full water allotment in order to ensure senior water users receive their full allotment. Senior and junior water rights refer to the priority order in which different entities receive their water allotment based on the historical time the water right was granted. If there isn’t enough water to supply full water allotments in a given year, then the junior water users do not receive the total amount of water set in their water right.
What does the future of water supply look like in Washington?
Warm and wet winters like 2025-26 will unfortunately become more common in Washington’s future. The maps below show the ratio between maximum SWE (snowpack) and precipitation. Watersheds in green are considered “rain dominant”, those in blue are considered “snow dominant”, and those in orange are “mixed rain and snow”. The upper left map shows conditions as they stand today, with snow dominant basins at high elevations and other mountainous basins in the mixed precipitation regime.
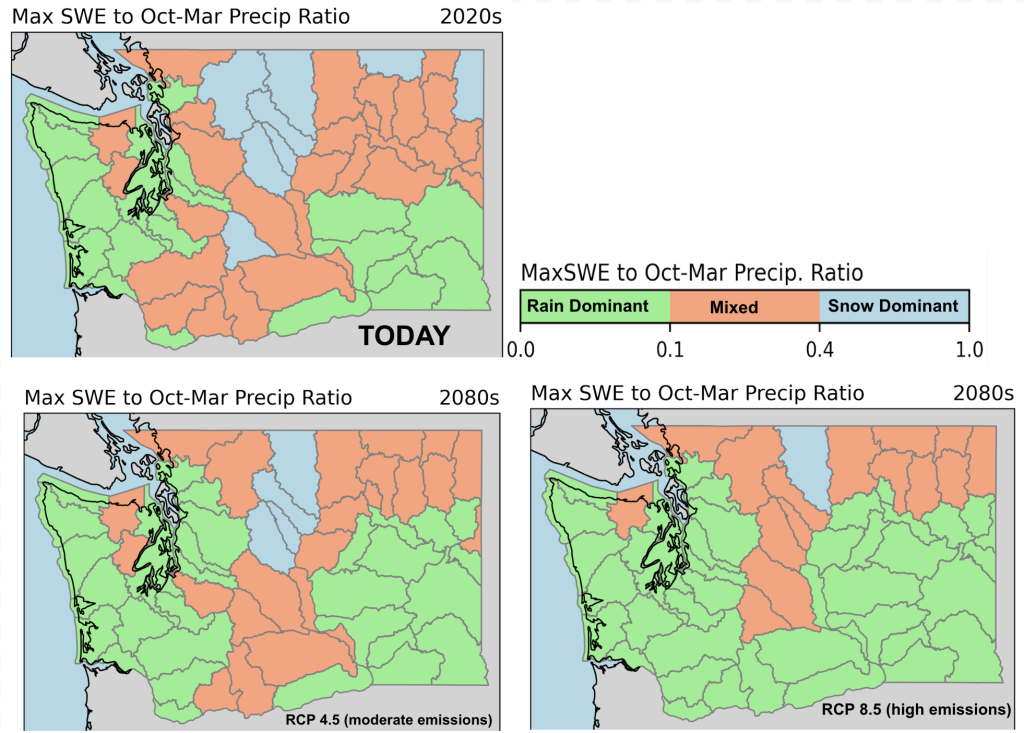 Maps of current and precipitation regime by watershed in Washington. Greens show rain dominant watersheds, blues show snow dominant watersheds, and orange shows mixed rain and snow watersheds.
The map in the lower left corner shows how these precipitation regimes will change by the 2080s, based on the RMJOCII hydrologic model and a low-to-moderate greenhouse gas scenario (RCP 4.5), while the map on the lower right corner shows conditions under a worst case greenhouse gas scenario (RCP 8.5). In both of these cases there is a notable decline in snow-dominant and mixed precipitation regimes, especially for the high-end emissions scenario.
These projections mean that we can expect more winter precipitation to fall as rain rather than snow, and an increasing number of low snowpack years as a result. This year’s warm winter provides a glimpse into our shifting hydrologic future and highlights the importance of continuing to adapt our water infrastructure, policies, and conservation efforts to these new conditions. Efforts are underway to adapt to these conditions in the Yakima Basin and elsewhere.