By Jacob Genuise
Key Messages:
- September brought cooler and wetter than normal conditions to most of the state. Conditions were especially wet relative to normal across eastern Washington, near Bellingham, and on the Olympic Peninsula.
- Snohomish County and Vancouver, WA were notable outliers with below normal precipitation.
- September 12-13 brought unseasonably large rain totals to the east slopes of the Cascades. This event ranked as the 3rd and 4th wettest September 2-day total on record in Yakima and Wenatchee, respectively.
- Below normal statewide temperatures in September broke a 10-month long streak of above normal statewide monthly temperatures.
In sharp contrast to the consistently warmer and drier than normal conditions during the summer, September brought notably cooler and wetter than normal conditions to much of the state.
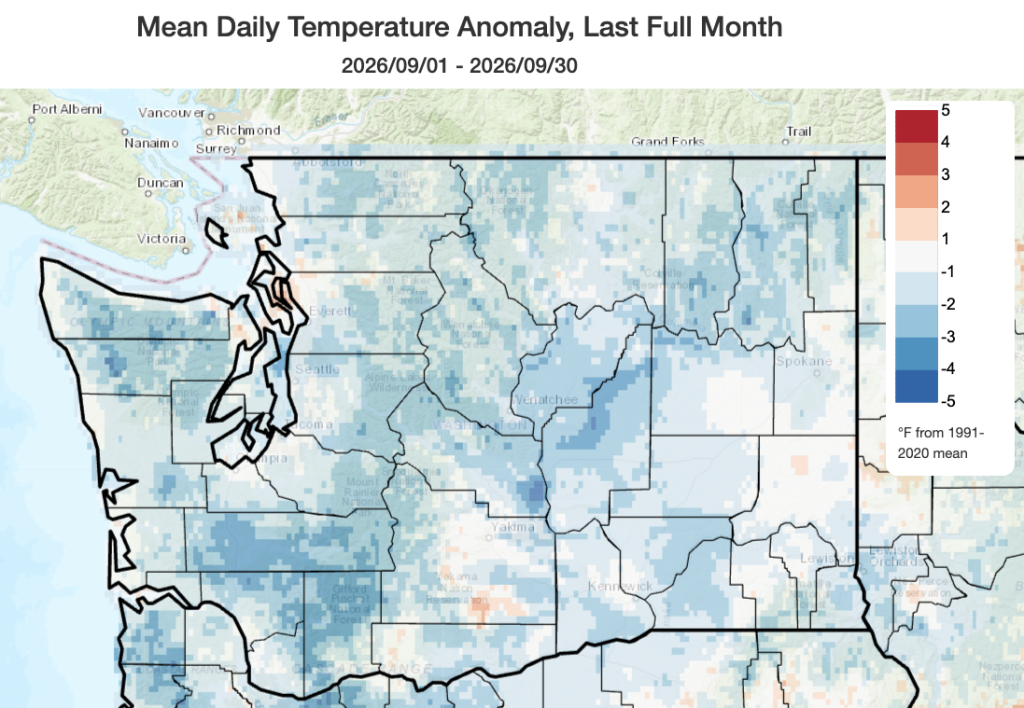 September 2026 mean temperatures compared to 1991-2020 normals.
Temperature:
Temperatures were around 1-2 degrees below normal across the majority of the state. Temperatures were coolest relative to normal across the southern I-5 corridor, southern Cascades, and along the Columbia River near Ephrata (-2.6°F below normal) and Moses Lake. SeaTac was -2.3°F below normal, Vancouver was -1.6°F below normal, Bellingham was -1.9°F below normal, and Spokane was -1.1°F below normal. Near the outer coast, temperatures were closer to normal including -0.7°F at Hoquium and -0.6°F at Quillayute. Small areas of Yakima County and Whitman County observed near or slightly above normal temperatures.
Below normal temperatures this past month broke an impressive 10-month long streak of above normal statewide monthly temperatures. The graph below shows the average monthly temperature departure since January 2025 relative to the 1991-2020 normal period. We have experienced above normal monthly temperatures, averaged statewide, for 16 out of the last 20 months. January, May, and October 2025 brought near-normal statewide temperatures and February 2025 was the last time we had well below normal temperatures statewide. The past 12 months (through September 2026) have been the second warmest October-September period since records began in 1895. The remarkably warm October 2015-September 2015 period remains the warmest such period on record.
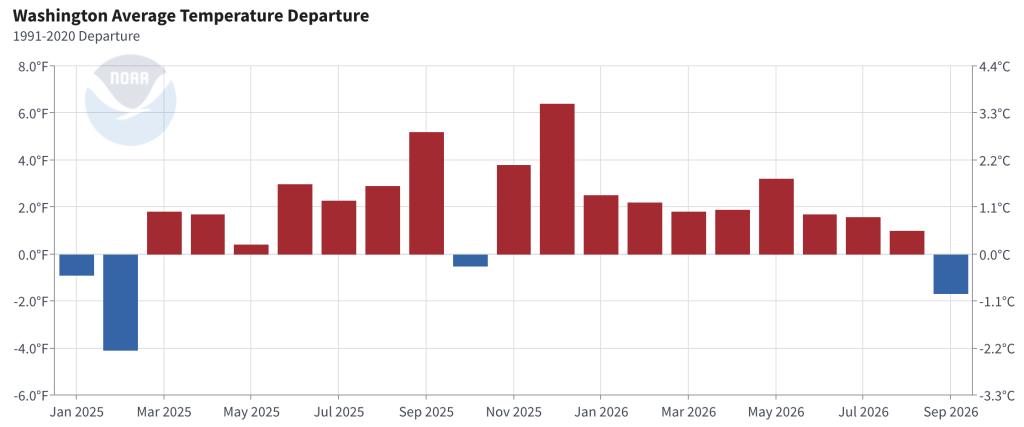 Average monthly temperature departure from 1991-2020 normals from January 2025-September 2026.
Precipitation:
September brought above normal precipitation to the Olympic Peninsula and across the majority of eastern Washington. The eastern slopes of the Cascades, north central and far eastern Washington received more than twice their normal September precipitation. The Climate Prediction Center’s monthly climate outlook for September, released last month, predicted this precipitation pattern well.
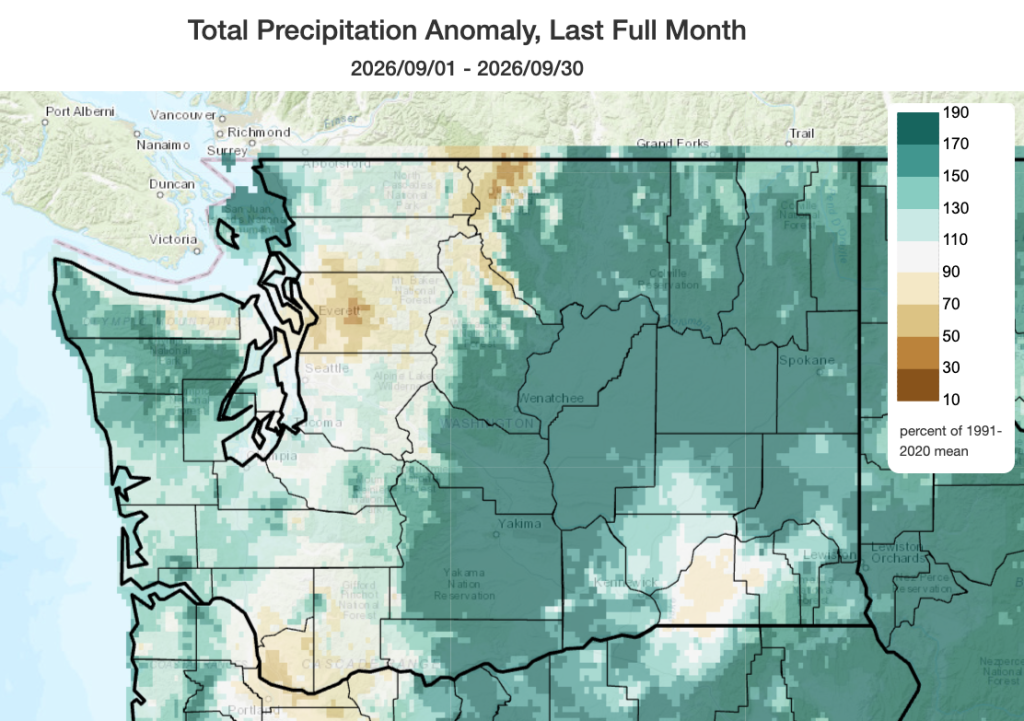 September 2026 precipitation as a percent of 1991-2020 normals.
September also reversed the multi-month streak of below normal statewide precipitation from April-August 2026. Since our major flood event in December 2025, 7 out of 8 months have brought less precipitation than normal, when averaged statewide.
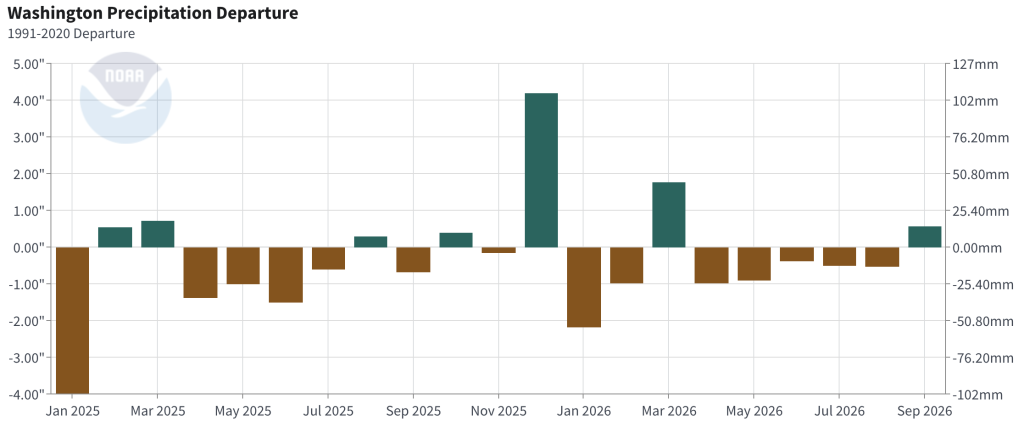 Average monthly precipitation departure from 1991-2020 normal from January 2025-September 2026.
The map below shows September monthly precipitation as a percentile of all Septembers from 1979-2020. This helps illustrate how these anomalies compare to past years. Shading in the darkest green-blue near Yakima and Ellensburg represent record wet conditions for September, and areas in the next lightest green-blue shading on the east slopes of the Cascades and in the Okanogans, Rockies, and the Olympic Mountains show that some areas experienced a wetter September than 90% of years since 1979. Near or slightly below normal precipitation occurred across most of Puget Sound and the western slopes of the Cascades. Its location on the southern edge of several storm systems allowed it to benefit from precipitation that otherwise fell primarily over British Columbia. Parts of Snohomish County, the upper elevations of the North Cascades, and areas near Vancouver, WA received below normal precipitation. Vancouver itself recorded only 57% of normal precipitation.
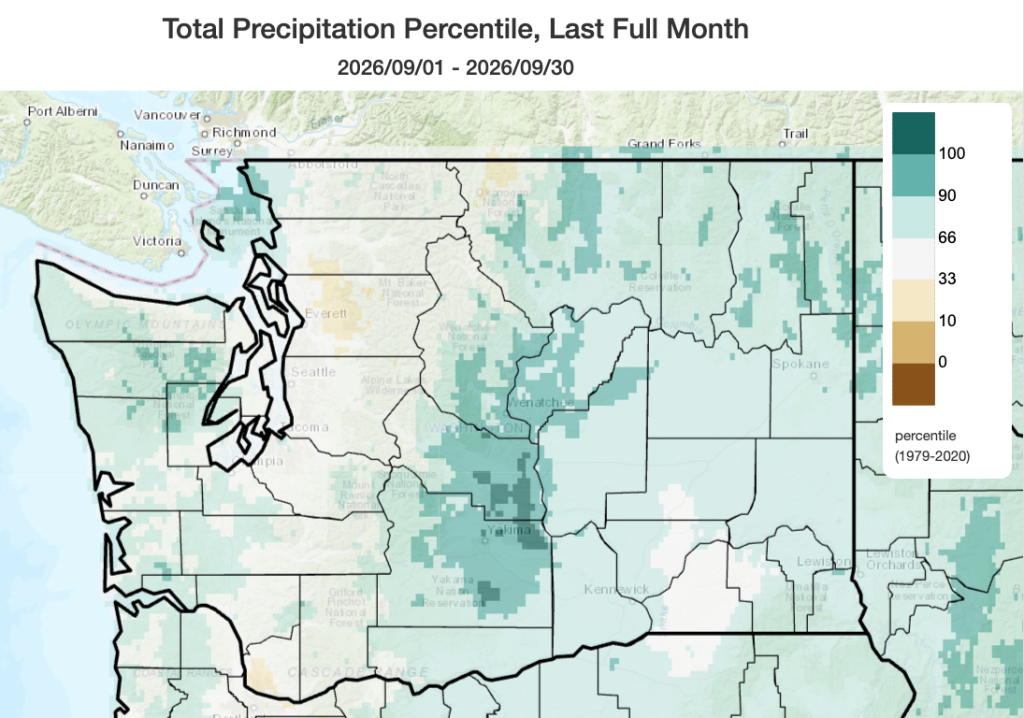 September 2026 precipitation percentile. Percentiles are calculated using the years 1979-2020.
Much of this precipitation on the eastern slopes of the Cascades came on September 12-13 with unseasonably large rain totals in Yakima and Wenatchee. This event brought the 3rd and 4th largest 2-day September rainfall total on record to Yakima and Wenatchee, respectively. Both sites observed 1.14” of rainfall during the 2-day event. These wet days along with other storms during the month caused Wenatchee to receive over five times its normal September precipitation (525% of normal) while Yakima received nearly eight times its normal amount (796%). These locations typically receive only a couple tenths of an inch of rain in September, so these totals were particularly large given they occurred so early in the season. Yakima typically received it’s heaviest rainfall in November-January. Wenatchee’s wettest 2-day records also occur during the winter, but also often occur during warm season thunderstorms. These early autumn rains were also very well timed for partial drought relief in important agricultural areas on the eastern slopes of the Cascades.
Yakima wasn’t only wet this September as measured by rainfall total accumulation (1.83” total rainfall for the month compared to a 1991-2020 normal of 0.23”); rainfall also occurred over a much longer duration than is typical for September. Yakima set a new record of 41 total hours of precipitation compared to a climatological normal of 11 hours. Having 41 hours of rain in a month is more typical of December or January in Yakima. The graph below shows the climatological normal number of rainy hours each month in Yakima (red bars), monthly observed rainy hours in 2026 (blue bars) and record maximum rainy hours per month (green squares).

More information on the day-to-day variations in weather for the past month and the warm/cold and wet/dry streaks can be found on the revamped National Weather Service climatology pages; you can access locations within the Seattle, Spokane, Portland, and Pendleton forecast areas.
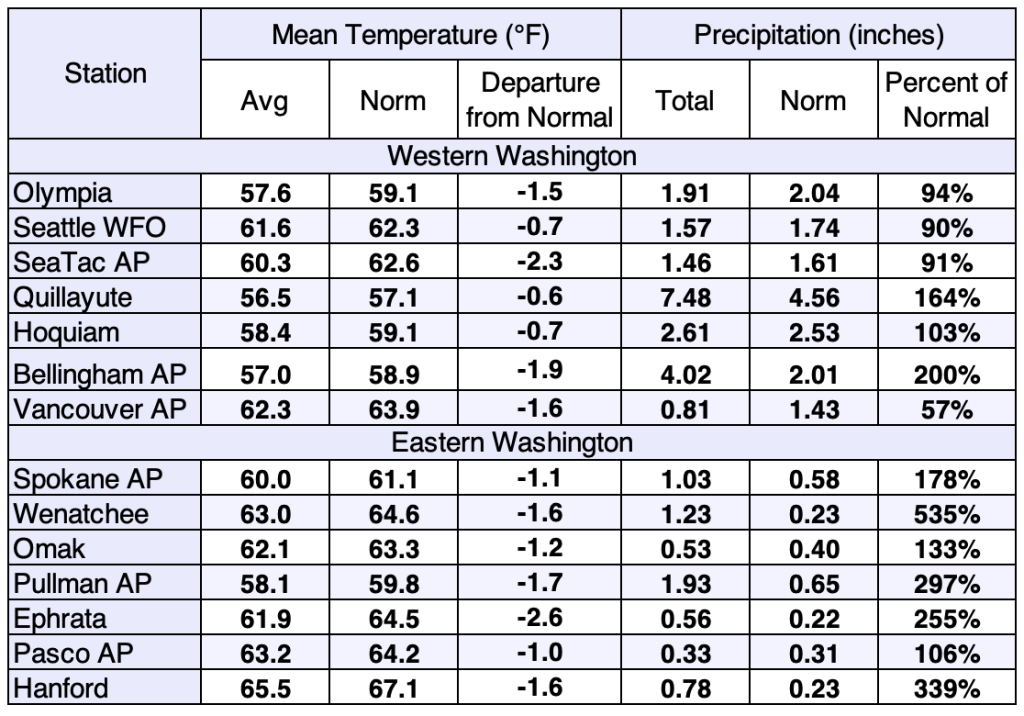 September 2026 climate summaries for select locations around Washington. Anomalies are relative to a climate normal baseline of 1991-2020.