By Jacob Genuise
Key Messages:
- Statewide SNOTEL stations have all melted out. This occurred about 3 weeks earlier than normal.
- Streamflows on snowpack-fed rivers remain well below normal with some gauges reporting record low streamflows. Briefly wet and cool periods near the beginning and end of the month did not bring nearly enough precipitation to meaningfully improve streamflows and water supply.
- Reservoir storage in the Yakima basin continues to fall more quickly than normal due to poor snowpack this past winter.
- Water supply forecasts have remained relatively unchanged, with continued expectations of well below normal summer water supply for all major rivers besides the Columbia.
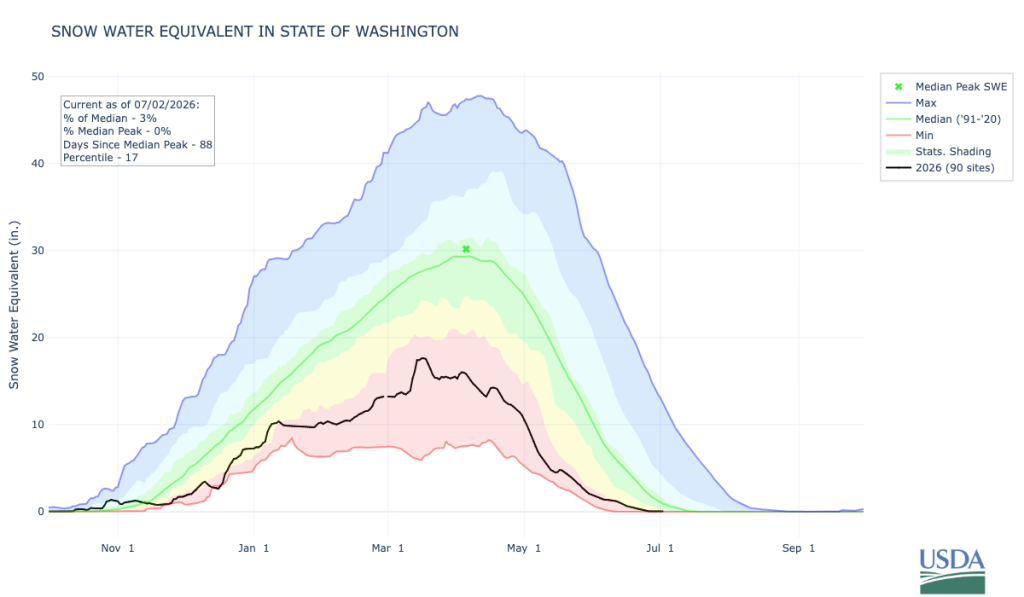 Statewide Snow Water Equivalent from October 1, 2025 through July 2, 2026. The solid green line represents the median SWE value from 1991-2020, and the black line represents SWE for the current water year. Red shading shows values below the 10th percentile (interpreted as being drier than 90% of all years), and yellow shading represents the 30-70th percentiles.
Snowpack has officially melted out at all SNOTEL gauges across the state, although some very limited non-glacial snowpack remains at the highest elevations. Statewide melt out, or the date when all SNOTEL stations reported no remaining snowpack, occurred on June 26, approximately 3 weeks earlier than normal. This early melt out was a result of much below normal peak snowpack and warmer than normal spring and early summer temperatures.
Since the middle of May, streamflows have continued to run much below normal (between the 1st and 10th percentiles) in most snowpack-fed rivers across the state. Streamflow gauges across the state are shown on the map below with brown dots indicating gauges with below normal streamflow.Gauges experiencing record low daily streamflow are marked with red exclamation marks.
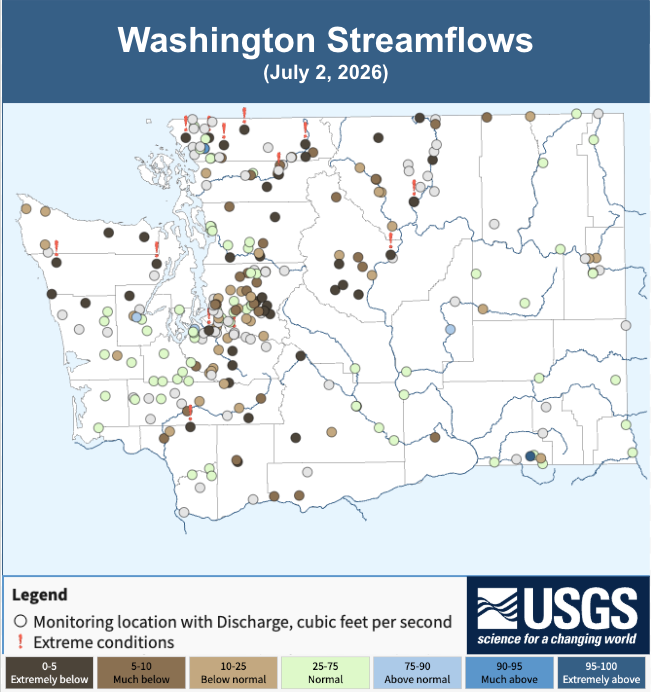 USGS streamflows map as of July 2, 2026.
Rivers are expected to continue to run near record lows throughout the rest of the summer unless enough precipitation falls to offset current deficits. This is less likely, as we are now in the climatologically driest 60-day period of the year in Washington. Lower elevation basins are running near normal (light green) largely due to near normal precipitation across western Washington during the past month. Gauges along the Columbia River in eastern Washington show near normal streamflows due to abundant snowmelt up north in British Columbia. Downstream gauges in the Yakima basin also are near normal solely due to reservoir releases upstream. A few gauges in the lower elevations of eastern Washington also show near normal streamflow, the reason for which is not very clear given 30-day and 90-day precipitation has been below normal in these basins. Some of these rivers did receive a short-term boost from scattered thunderstorms late in the month, and some small streams also can experience changes in streamflow due to human water use such as agricultural runoff.
The impacts of low snowpack and precipitation are evident in streamflow observations across multiple basins. That is illustrated here using graphs of daily streamflows for the Skykomish River near Gold Bar (western Cascades), the American River (a tributary to the Naches and then the Yakima River in the western Cascades), and for the Kettle River (in the Okanogans in northeastern Washington).
For all of these rivers, low spring snowpack and below normal precipitation over the past 90 days has caused June streamflows to drop much below normal. The darkest brown shading represents the bottom 5% of flows historically. There are a few small, short-lived increases in streamflow during wetter periods of the month, but the bigger picture over time is more important from a water supply perspective.
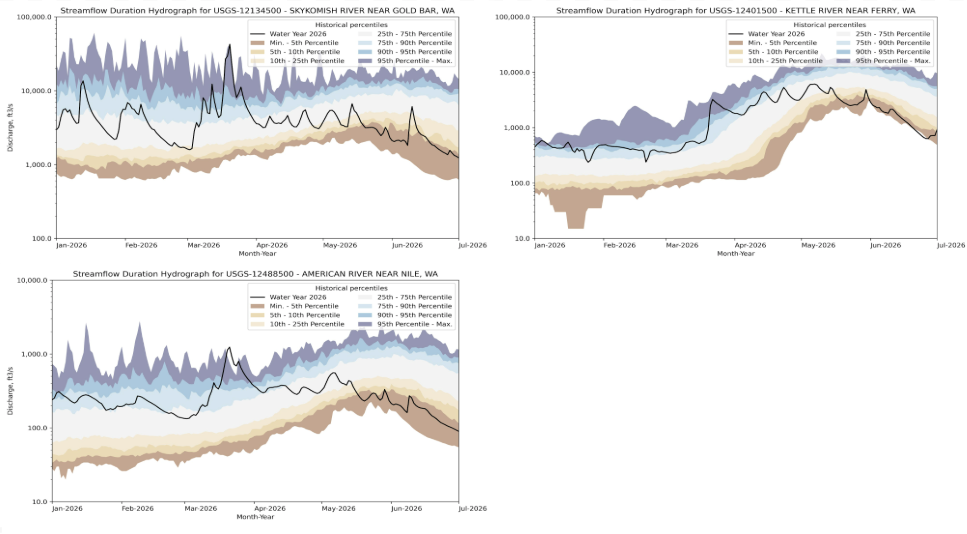 Streamflow hydrograph from January 1- July 2, 2026 for the Skykomish River in the west Cascades (top left), the American River in the east Cascades (bottom left), and the Kettle River in northeastern Washington Okanogan Highlands (top right).
The updated Yakima Basin Total Storage on the graph below shows that current reservoir storage (shown by the blue line) has continued to decrease more rapidly than average throughout the month, and storage is now below average for this time of year. Storage levels are not as low as last year at this point in the season, and the latest bureau of reclamation May 21-September 30 water supply forecast for the basin has improved slightly from an expected delivery of 52% of junior water rights holder’s full entitlement to 56% of their full entitlement.
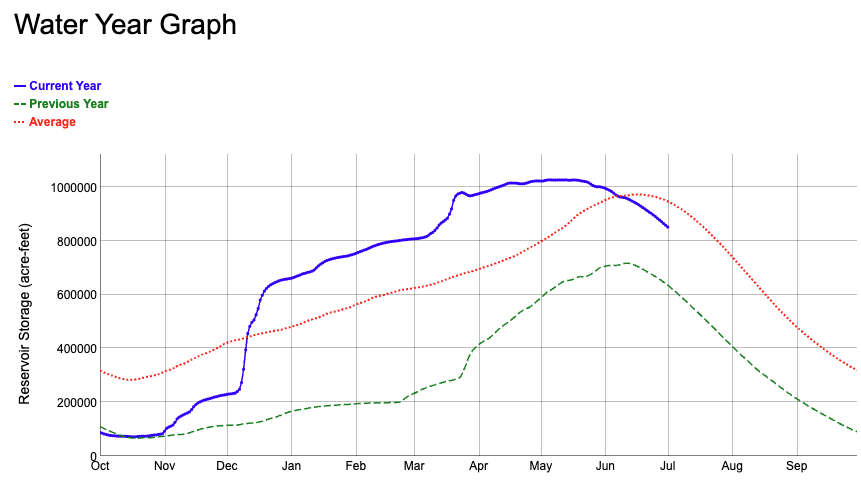 Yakima River Basin total reservoir storage through July 1, 2026. Data from the U.S. Bureau of Recreation. The solid blue line shows current year storage. The dashed green line shows last year’s storage. The dotted red line shows average reservoir storage.
The U.S. Drought Monitor indicated worsening drought conditions across western Washington and the western Okanogan Highlands including expansion of D2 “Severe Drought” in Okanogan County and an expansion of abnormally dry conditions across the Olympic Peninsula and the western slopes of the Cascades. There was some improvement in Ferry County thanks to some favorable precipitation during the month, but D1 “Moderate Drought” remains. The drought monitor map below (as of June 30, 2026) and the following change map illustrate these conditions.
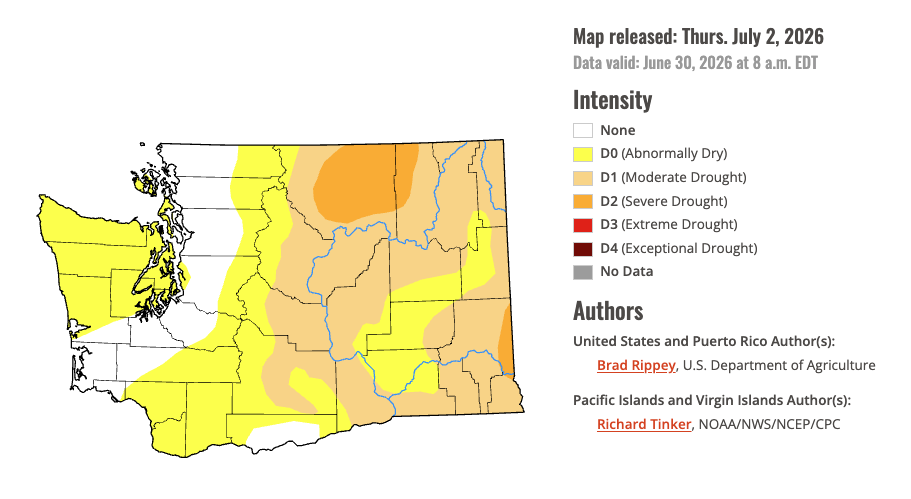 U.S. Drought Monitor for Washington. Data valid on June 30, 2026.
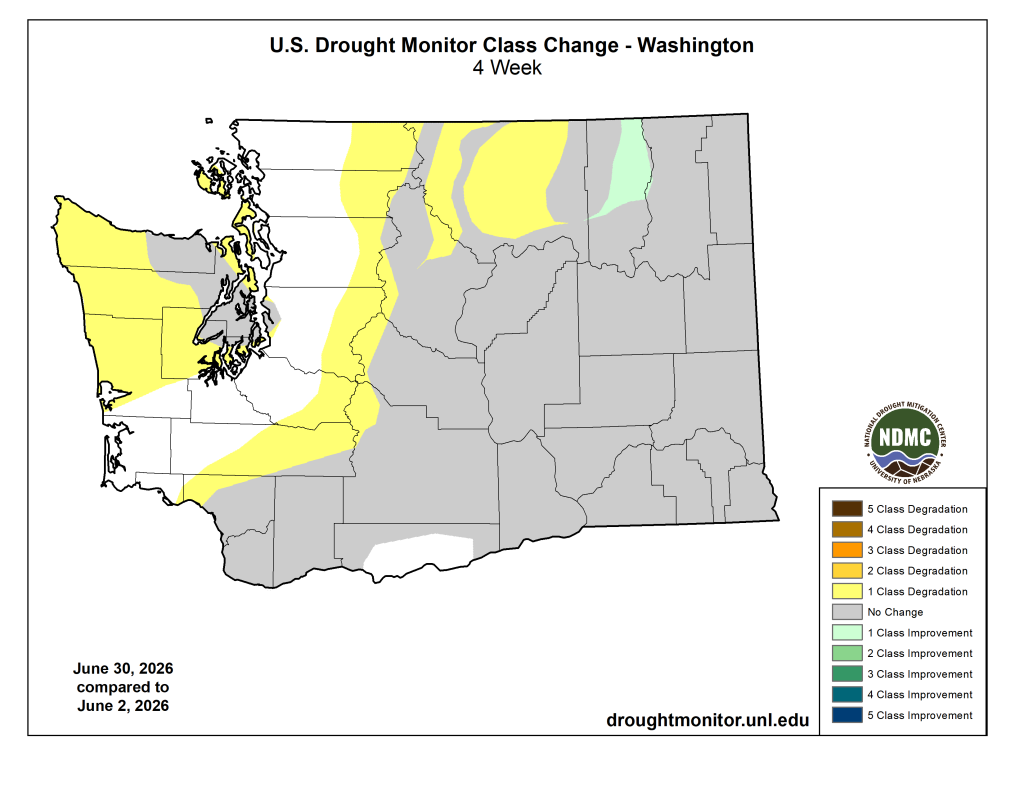 U.S. Drought Monitor class change from June 2 to June 30, 2026.