By Jacob Genuise
Key Messages:
- October was drier than normal across much of the state. The higher elevations of the north Cascades as well as the eastern Cascades foothills and adjacent plains received less than 30% of normal precipitation.
- The first half of the month was particularly dry, with infrequent rain and clearer skies than normal.
- October temperatures were +2-4°F above normal for much of the state, although small pockets of near normal temperatures (±1°F) occurred in a few low-lying river basins.
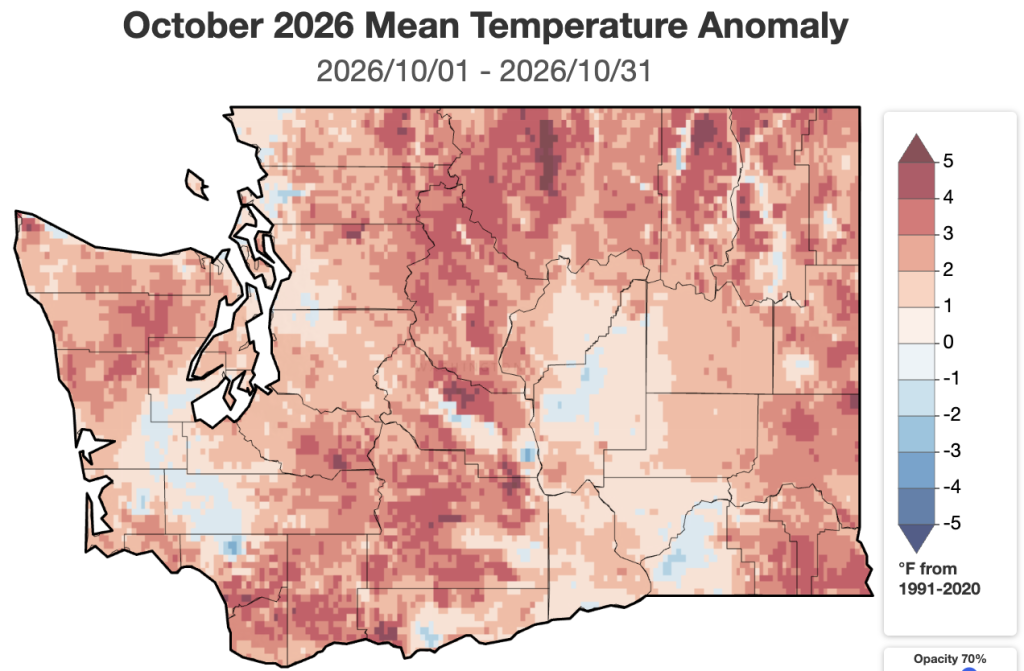
Temperature: October temperatures were around +2-4°F above normal across the majority of the state. Temperatures were warmest relative to normal this October across the Cascades, Olympics, Okanogans, and far eastern Washington. Temperatures were +3.5°F above normal in Spokane, +1.9°F in Vancouver, +1.7°F above normal in both Wenatchee and Pullman, and +1.6°F above normal in Ephrata. Sea-Tac and Olympia were also both warmer than normal. This was in contrast to the below normal temperatures most of us experienced in September. Temperatures elsewhere around Puget Sound were closer to normal. A few pockets of mainly low-lying river basins across eastern and western Washington saw near normal or slightly below normal temperatures. This was mainly driven by cooler than normal nighttime temperatures in the Chehalis River Basin and portions of the Columbia River and Snake River basins.
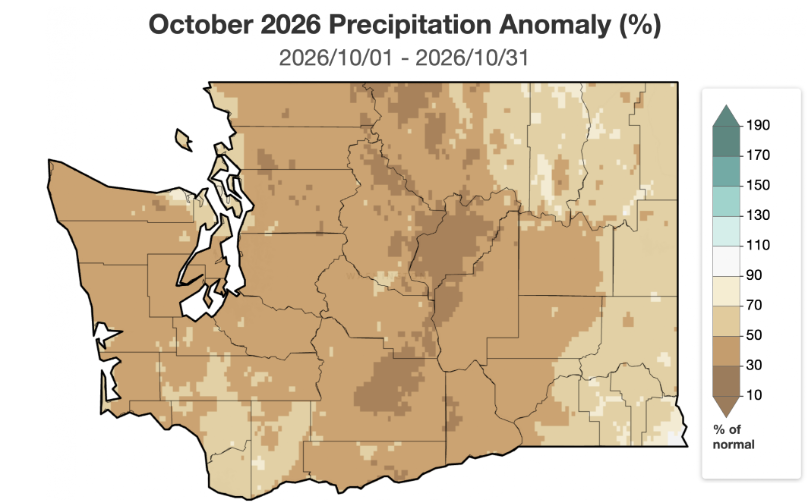 October 2026 precipitation as a percent of 1991-2020 normals.
Precipitation: October precipitation was well below normal across much of the state. The driest areas relative to normal were in the Cascades and especially in the eastern foothills and adjacent plains of the Cascades. These areas received less than 30% of normal precipitation. Wenatchee (27% of normal), Ephrata (17% of normal), and Omak (8% of normal) were among the driest locations relative to their typical October precipitation. Precipitation was near or less than 60% of normal across most of western and central Washington including 63% of normal in Olympia, 55% of normal in Bellingham, 33% of normal at the Seattle-Tacoma Airport and at the Seattle WFO. Spokane also recorded only 53% of normal precipitation for the month.
Conditions were a bit less dry relative to normal across northeastern Washington and far southeastern Washington, but these areas still received only 50-90% of normal precipitation. Pullman received 72% of its normal monthly precipitation.
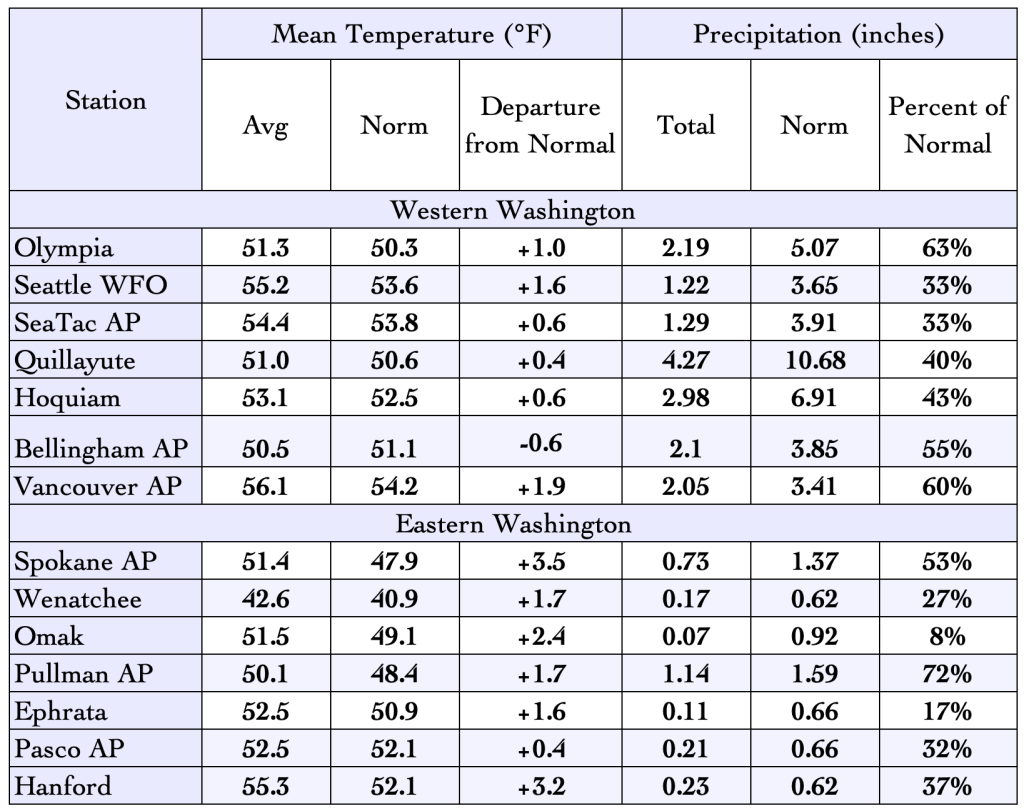 October 2026 climate summaries for select locations around Washington. Anomalies are relative to a climate normal baseline of 1991-2020.
The map below of solar radiation for the first half of the month, courtesy of Oregon State University’s PRISM, also provides evidence of exceedingly dry October conditions. Large areas of western Washington saw nearly twice their typical solar radiation due to reduced cloud cover over the region.
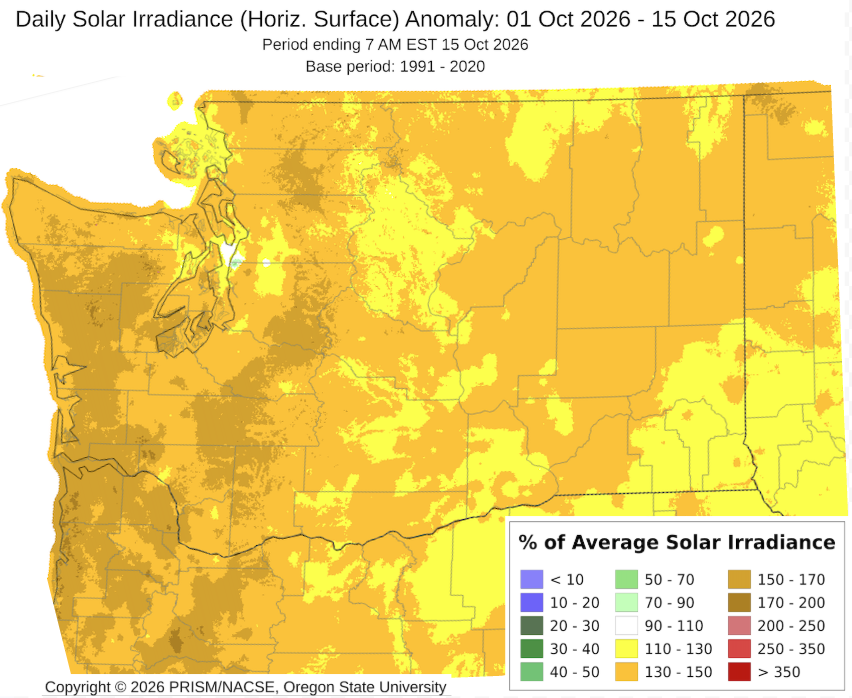 Average solar radiation from October 1-15, 2026 as a % of 1991-2020 normal.
October also featured below normal rainfall duration.At both Seattle and Spokane , October brought around half the normal number of rainy hours (35 hours in Seattle compared to 77 hours normally, and 16 hours at Spokane compared to 35 hours normally). This means that not only were rainfall amounts below normal and sunshine above normal, but most of us also experienced less rainy hours than normal. If this fall has felt a bit drier and sunnier than normal, these data also back that up.
The graph below helps us get a sense for how October temperatures and precipitation compare to past Octobers. The pink diamond shows statewide average conditions this past month, and light red dots represent all previous Octobers back to 1979. Temperatures were not very remarkable compared to past years, but precipitation ranked as the 5th driest statewide in this dataset. Last month’s outlook from the Climate Prediction Center (CPC) correctly predicted warmer than normal conditions nearly statewide and the dryness across eastern Washington, but it did not predict the dryness across far northwestern Washington. As far as seasonal forecasts go, this year’s CPC October forecast verified quite well overall.
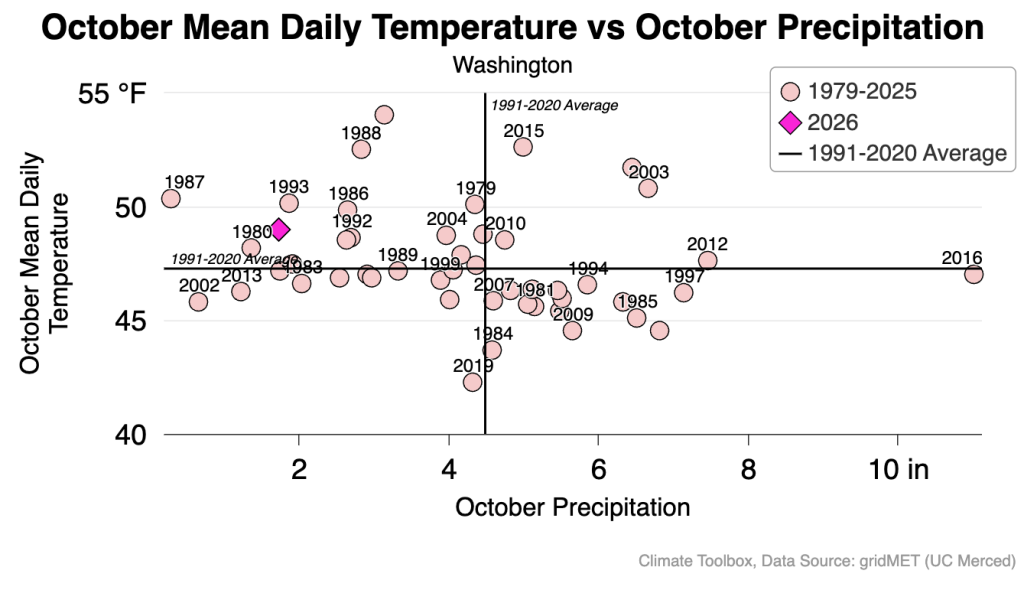 A scatter plot of statewide October mean temperatures (vertical) and October precipitation (horizontal) from 1979-2026. Statewide values for October 2026 are noted by a pink diamond. All previous years are shown as light red circles. 1991-2020 normals are noted with solid black lines.
More information on the day-to-day variations in weather for the past month and the warm/cold and wet/dry streaks can be found on the revamped National Weather Service climatology pages; you can access locations within the Seattle, Spokane, Portland, and Pendleton forecast areas.