By Karin Bumbaco
We’re more than a month into the 2027 water year, so it’s a good time to pause and review the 2026 water year. As a reminder, a water year begins in October and ends in September in order to align better with our wet and dry seasons across the western U.S. Average temperatures compared to normal and total precipitation percent of normal for the full water year (October 2025-September 2026) are shown below.
 Average water year temperature departure from the 1991-2020 normal (left) and precipitation percent of normal (right).
Water year temperatures were warmer than normal across the entire state, with greater temperature anomalies exceeding 2°F across the majority of eastern Washington. Averaged statewide, the water year ranked as the 2nd warmest since records began in 1895, behind 2015. Ten out of the twelve months of the 2026 water year had statewide average temperatures above normal – only October 2025 and September 2026 were cooler than normal, bookending an otherwise warmer than normal water year.
To give further context into the warmth as it progressed during the water year, let’s step through some monthly and seasonal rankings (see below). Averaged across Washington, December was much warmer than normal and ranked as the warmest December on record. Combined with a November temperature anomaly of close to 4°F above normal, this boosted the October-December period into the warmest fall on record. These records go all the way back to 1895.
Above normal temperatures continued into the new calendar year through August, with January, February, April, and May all at least 2°F warmer than normal. April-May ranked as the 4th warmest on record, and while June-August was warmer than normal, the anomalies were not as large relative to normal as many of the other months in the water year. Finally, September ended the water year on a cooler note, with temperatures 1.7°F below normal.
 Monthly temperature anomalies (°F; top) and percent of normal precipitation averaged over Washington for the 2026 water year relative to the 1991-2020 average.
Total water year precipitation for large swaths of Washington was near-normal. Pockets of slightly drier than normal water year conditions (between 70 and 90% of normal) emerged in southeast Washington, north central Washington, and in the rainshadow of the Olympic Mountains. In contrast, most of the northern and central Cascades received slightly above normal water year precipitation (between 110 and 130% of normal). Averaged statewide, total water year precipitation was near-normal (remarkably close with 101% of normal). In contrast, the previous three water years were each drier than normal.
The seasonal precipitation anomalies tell a much more nuanced story, however. The above normal water year precipitation in parts of the Cascades was largely driven by an exceptionally wet December (5th wettest; 166% of normal), with associated flooding. We’ve previously put both the precipitation and streamflows into historical context in the Climate Matters series. As a result, October-December were wetter than normal. A mid-winter dry spell then took hold as a large ridge of high pressure dominated our weather pattern resulting in 65% and 77% of normal precipitation for January and February, respectively. There was brief reprieve with a wetter than normal March (139% of normal) before drier than normal April-August. Finally, the water year ended with a wetter than normal September.
The seasonal progression of temperature and precipitation anomalies resulted in a much below normal snowpack by April 1, 2026. The snow accumulation for the water year compared to the historical record is shown below. Average statewide snowpack was less than the 10th percentile for a majority of the season. While there was a wet start to the water year, the much above normal temperatures caused precipitation to fall as rain, rather than snow, in the mountains. While there was considerable snowpack building in late December, the subsequent dry spell in January and February halted additional snowpack growth. Overall, snowpack peaked on March 17 for the state, much earlier than the typical April 5 peak. Furthermore, that mid-March peak was short-lived, as much of the gains melted off quickly. By April 1, the average statewide snowpack was the 3rd lowest since 1981 at just about half of normal. The Washington State Department of Ecology, with Governor Ferguson’s approval, declared a statewide drought emergency on April 8 as a result.
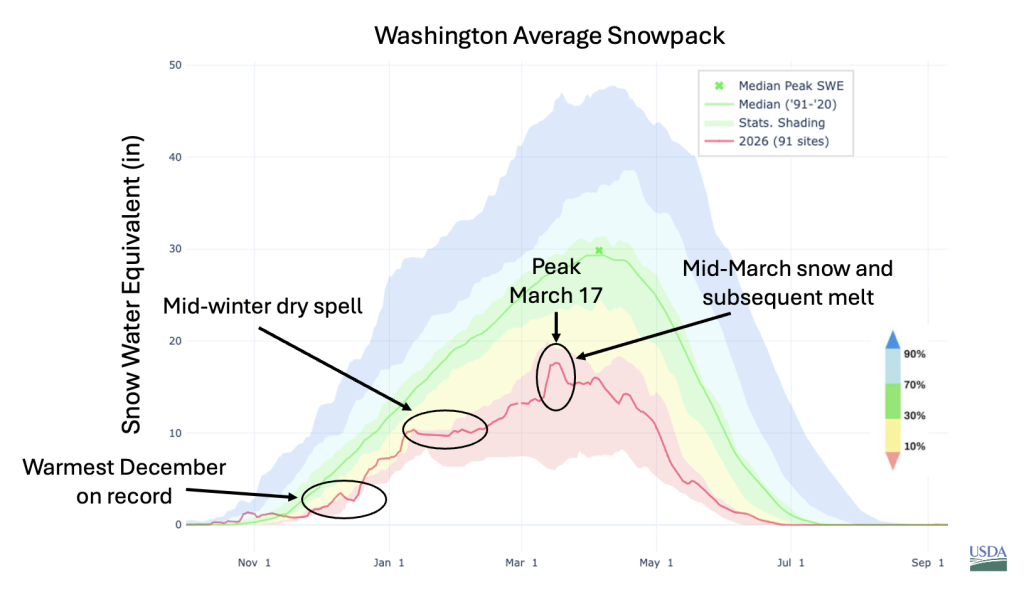 Snowpack accumulation over the course of the 2026 water year compared to historical percentiles.
Streamflow over the course of the water year varied depending on geographic location and whether the watershed resided in a rain or snow-dominant basin. Three examples are shown below. One for a mixed rain/snow basin – the Dungeness River near Sequim on the Olympic Peninsula (upper left) – one for a snow dominated basin – the American River near Nile on the eastern crest of the central Cascades (upper right) and one for a rain dominated basin – the Chehalis River near Grand Mound in southwest WA (bottom left). Near record high streamflows in December are observed for all three in line with the atmospheric rivers and high freezing levels. Early snowmelt in late March/early April showed up as temporary peaks on the Dungeness and American Rivers before flows on these rivers fell to less than the 10th percentile from May through the end of the water year. The Dungeness was at record lows beginning in July for most of the rest of the water year. The Chehalis, on the other hand, was largely in the near-normal streamflow range through most of our dry season, and was then boosted by rains in September.
 Streamflow compared to historical percentiles for the Dungeness River near Sequim, American River near Nile, and Chehalis River near Grand Mound.
Unfortunately, over 900,000 acres (NIFC) in Washington have burned so far this calendar year, marking 2026 as the 2nd highest total acres burned since modern records began in 2002 – second only to 2015. A number of these fires, notably those in the Spokane area in early August, caused massive destruction to property and livelihoods. The exceedingly warm water year temperatures and drier than normal conditions at critical points throughout the water year primed the landscape for wildfires. You can read more about the many factors that drive wildfire in our region in our past Climate Matters written by Brian Harvey at UW SEFS.
The impacts of the water year are not yet fully known or synthesized. We have an ongoing effort to document impacts due to either abnormally wet or abnormally dry conditions across the Pacific Northwest – if you have impacts to share then we encourage you to fill out the Annual PNW Water Year Impacts Survey. The survey should take about 15 minutes to complete and will be open through Friday, December 11. We welcome reports of impacts from those working in the water, agriculture, forestry, fisheries, hydropower, public health, and recreation sectors, as well as tribal, local, state, and federal agency staff that work with these sectors. Furthermore, your responses will inform the PNW Water Year Impacts Assessment.