By Nick Bond
The last section of our newsletter features reproductions of monthly and seasonal weather forecasts for WA from NOAA’s Climate Prediction Center (CPC). How good actually are these forecasts?
We analyzed an archive of past CPC temperature and precipitation seasonal forecasts, and corresponding observations, for the years of 1995-2015 in Washington State. The archive is available online and includes seasonal forecasts for a series of lead times, with the lead time referring to the interval between the time that the forecast is produced and the start of the period being predicted. We have focused on the results of forecasts with lead times of 0.5 and 3.5 months for the seasons of Jan-Mar, Apr-Jun, Jul-Sep and Oct- Dec. The forecasts are categorical, indicating the probability of mean temperature and precipitation anomalies reaching thresholds of below or above normal conditions versus near neutral. The procedure used was to compare the forecasts with the observations for the 5 national forecast divisions (#72-76) encompassing Washington state; division #73 extends into northeast Oregon and northern Idaho while division #74 extends into northeast Oregon (map). For these divisions, we average the Heidke Skill Score over all 5 regions (results presented in Table 1). The Heidke Skill Score is a measure of forecast accuracy, and relates to the frequency of correct forecasts relative to that which would occur by chance.
We estimate the Heidke Skill Score (HSS) using the following equation:

where e is the number of grid points expected to be correct by chance, c is the number of correct grid points, and t is the total number of grid points. The HSS has a range from -50 (the “worst possible” forecast) to 100 (a “perfect forecast”) for a 3-category system. A value of 0 represents a forecast that is no better than flipping a three- sided coin (O’lenic et al. 2008; Peng et al. 2012); a score of 50 implies that two-thirds of the individual forecasts verified as correct. A value of approximately 30 for HSS represents the threshold of “useful” forecasts in many applications.
A second analysis was done using a different CPC website with seasonal forecast verifications for lead-time of 0.5 months over a historical period beginning in 1995. For the years of 1995 through 2016 and all four non-overlapping seasons, and for Washington state as a whole, we determined the number of correct forecasts of below or above normal conditions versus the number of category 2 errors, that is, with a validation of opposite sign to the forecast. For example, a category 2 error would occur if below normal temperatures were forecast for a majority of WA state, but in actuality, the temperatures verified as above normal for that same period. We disregarded periods with a near-neutral forecast or validation. The counts of correct/incorrect forecasts are shown in Table 2.
Some general conclusions can be drawn. First, seasonal temperature predictions tend to be more skillful than seasonal precipitation predictions, as found in previous studies (e.g., Peng et al. 2012). The overall difference in skill between the 0.5 and 3.5 month lead times was small, with the shorter time horizon yielding substantially better predictions only for temperature in winter and for precipitation in summer. For precipitation in winter, the longer lead forecasts were actually superior, but this is probably a fluke. The lack of skill is striking in the seasonal forecasts for both temperature and precipitation for the first three months of the water year (October through December). October through December 0.5 month lead precipitation forecasts had the highest number of Category 2 errors in the 1995-2016 time period as well (Table 2), though the temperature and precipitation 0.5 month lead forecasts for Jan-Mar had relatively few (1 and 2, respectively).
Presuming that the output from global climate models is becoming increasingly relied upon for seasonal weather forecasts, and that these models are subject to continual improvement, it might be supposed that seasonal forecasts are getting better. At least for WA, that does not appear to be the case. Time series of CPC skill (not shown) lack any sort of systematic trends for temperature and precipitation. Besides, the records that are easily available are too short to say much about this with any confidence. It is known that seasonal weather predictions tends to be better across much of the US, including the Pacific Northwest, during ENSO events (e.g., Peng et al. 2012). Ongoing research is being devoted to identifying and exploiting additional sources of predictability for the weather on seasonal time scales, but progress here is slow. The mid-latitude atmospheric circulation is chaotic on time scales longer than a few weeks, and hence there are inherent limits to the predictability of the future weather beyond those time scales. Nevertheless, our brief review of seasonal forecasts from CPC suggests we should continue to consider them.
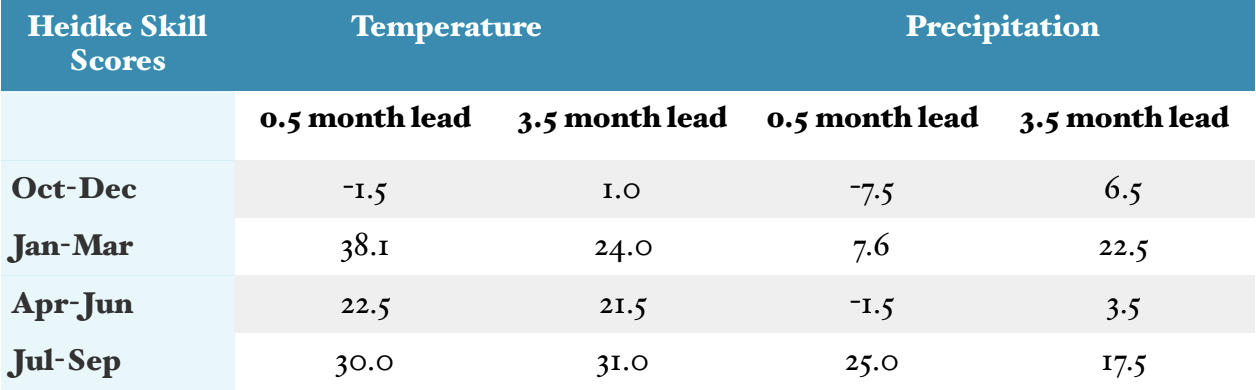 Table 1: The Heidke Skill Scores (HSS) for temp (left) and precipitation (right) seasonal forecasts for different forecast lead times and seasons.
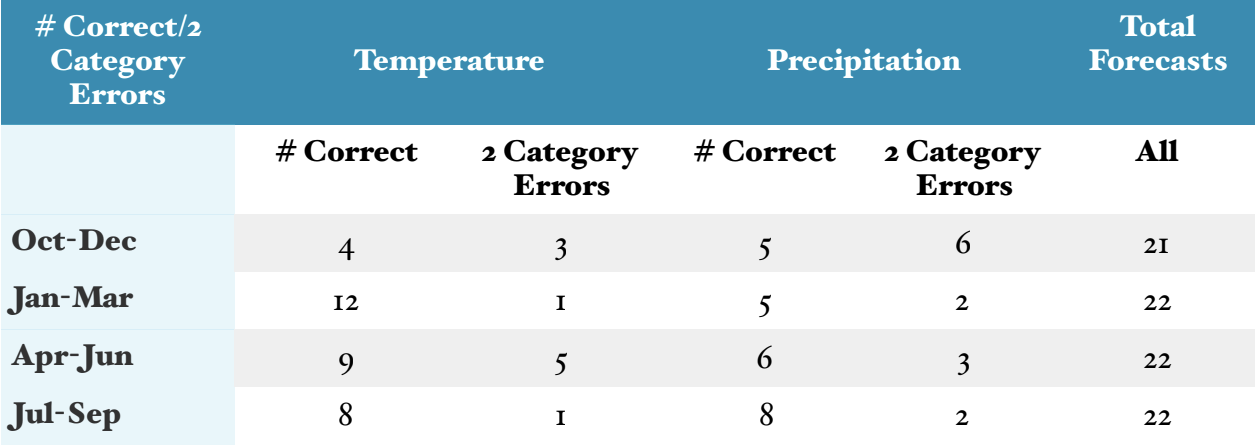 Table 2: The number of correct forecasts and the number of incorrect forecasts (by 2 categories) for temperature (left) and precipitation (right) forecasts.
References
O’Lenic, E.A., D.A. Unger, M.S. Halpert, and K.S. Pelman, 2008: Developments in operational long-range climate prediction at CPC. W ea. Forecasting, 23, 496-515.
Peng, P., A. Kumar, M. S. Halpert, and A. G. Barnston, 2012: An analysis of CPC’s operational 0.5-month lead seasonal outlooks. W ea. Forecasting, 27, 898–917.