By Jacob Genuise
April was a dry and warm month for nearly all portions of the state. Statewide, precipitation was 1.41″ below our 1991-2020 average April precipitation. April 2025 also ranked as the 30th driest April since 1895. In eastern Washington, the Tri-Cities received below normal precipitation including 76% of normal in Pasco. The eastern slopes of the Cascades, the Blue Mountains/Snake River Basin, and the southern I-5 corridor near Vancouver were among the driest regions of our state relative to normal in April. Many of these areas received less than 50% of their normal April precipitation including Wenatchee and Omak (37% and 41% of normal, respectively), Pullman (44% of normal), Vancouver (38% of normal), and Spokane (31% of normal). Isolated portions of these regions received only 10-20% of normal precipitation.
 April Precipitation (left) and temperature(right) anomalies as a percent of 1991-2020 mean precipitation.
Stations near Puget Sound fared a bit better compared to much of eastern Washington, but precipitation still came in well below normal for the month. Bellingham (54% of normal), Hoquiam (56% of normal), and Olympia (66% of normal) received around half of their normal April precipitation. The April 20th Puget Sound Convergence Zone rain event (see April Notable Weather Events for a deeper dive into this event) contributed to the small area of near-normal precipitation in and around Seattle and helped boost SeaTac’s rainfall totals to around 80% of normal precipitation for the month.
Statewide temperatures were +1.8°F above our 1991-2020 April normal. April also ranked as the 25th warmest April in Washington since 1895. This includes anomalies of +2.0°F at SeaTac, +2.0°F at Vancouver, and +2.5°F at Spokane. Mountainous areas and much of western Washington observed the warmest anomalies while localized portions of southeastern Washington observed near-normal or even slightly below normal temperatures. This included a slight cold anomaly of -0.4°F at Pullman Airport for the month.
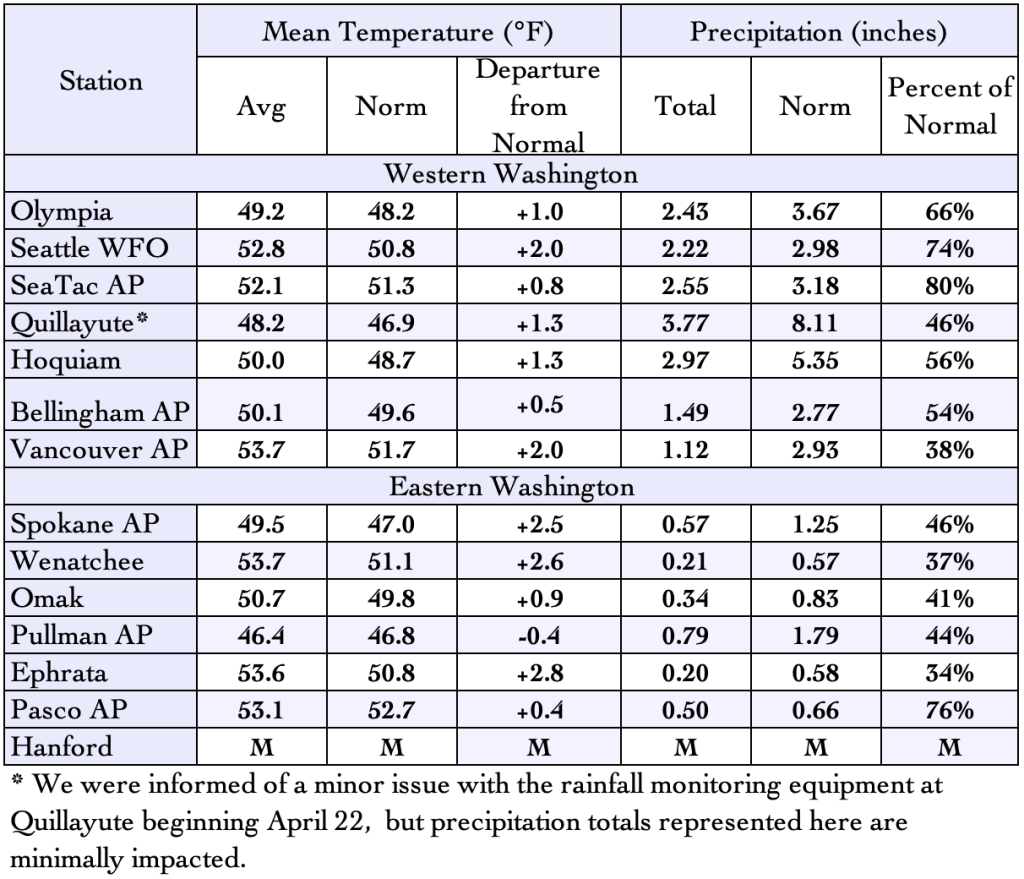 April 2025 climate summaries for locations around Washington. Anomalies are relative to a climate normal baseline of 1991-2020. M denotes missing data.