By Jacob Genuise
Key Messages:
- Streamflows in mountain basins continue to run below normal. September rains boosted streamflows across western Washington to near normal at the start of October.
- Seasonal precipitation deficits continue to limit monthly streamflows across the state, especially in mountain-fed rivers in the Cascades and Olympics.
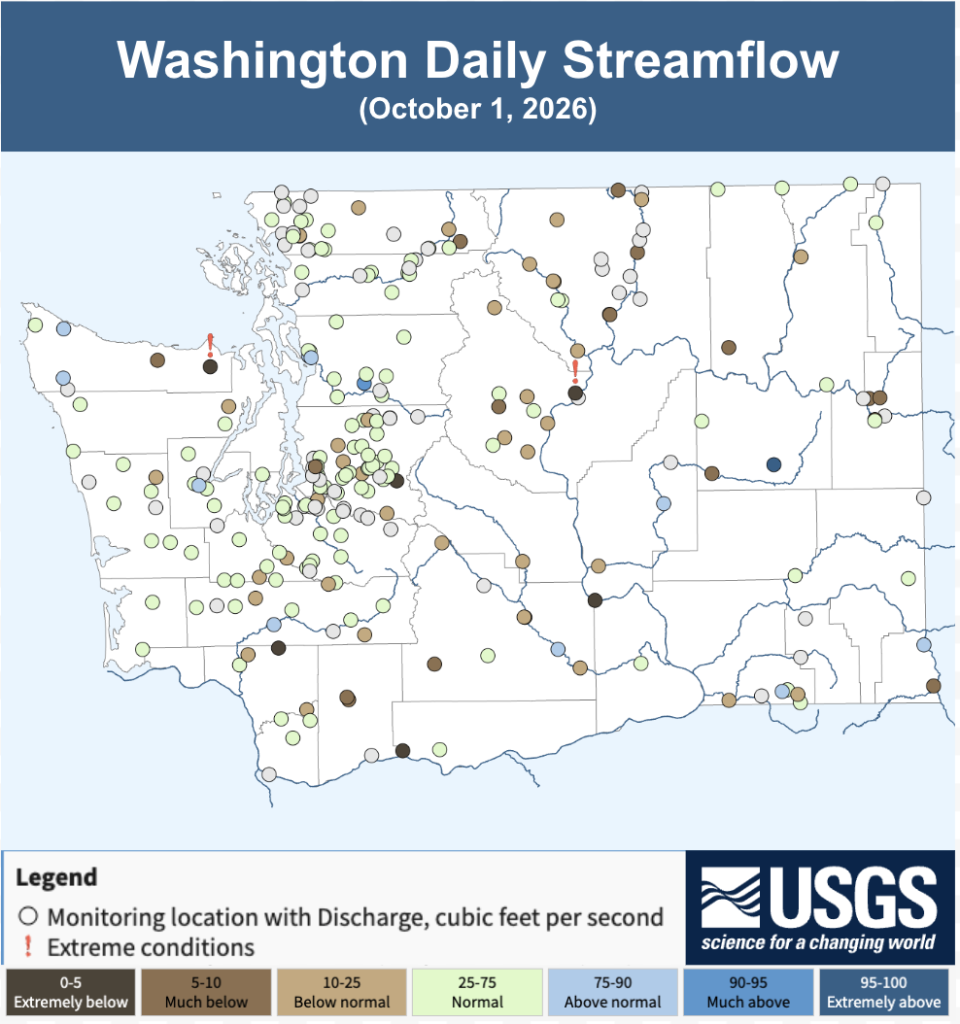 USGS streamflow map showing a single-day snapshot of streamflows on October 1, 2026.
This map of streamflows above provides a single-day snapshot of streamflows across the state. Heavy precipitation across the Olympics and western Cascades on September 27-30 have boosted streamflows to near normal in these areas. They are likely to return to below normal levels in early October given the likelihood of a dry period early in the month. The stations experiencing low streamflows are colored in brown on this map, and largely occur along mountain-fed rivers on the eastern slopes of the Cascades and throughout eastern Washington. Despite abundant precipitation in September for most of these locations in eastern Washington, (see our September Climate Summary for more information on last month’s precipitation and temperatures) longer term precipitation deficits this summer continue to cause low streamflows. Six month precipitation deficits are shown in brown on the map below. Deficits are especially large in the upper elevations of these basins. Snowpack deficits from this past winter are likely not contributing to low streamflows on non-regulated rivers at this point in the season as late summer and fall streamflows are more closely related to spring and summer precipitation than to the previous winter’s snowpack. Read more about this in our recent Climate Matters on snowpack and late season streamflow correlation.
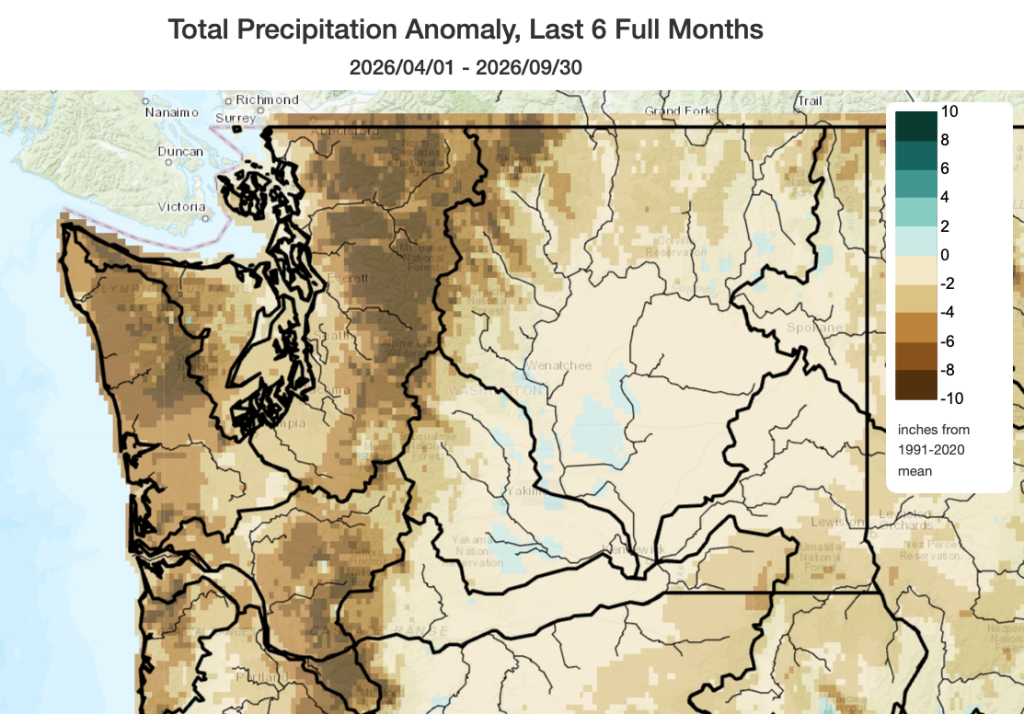 Total precipitation departure from normal from April 1, 2026 – September 30, 2026. Long-term precipitation deficits continue across most basins despite September rains. Dark black lines indicate HUC-4 watershed boundaries, shorelines, and political boundaries. Thinner black lines indicate major rivers in the state.
Water year 2027 officially began on October 1st, and the Yakima Basin reservoirs have unfortunately kicked off the water year with below normal total basin storage. This year has been bookended by two rare rainfall events that softened the impacts of this year’s drought in the basin. Without this well-timed September downpour in the Yakima Basin and the December 2025 heavy rainfall event, the latter of which alone provided around 400,000 acre-feet of additional reservoir storage, drought impacts would likely have been much worse this year.
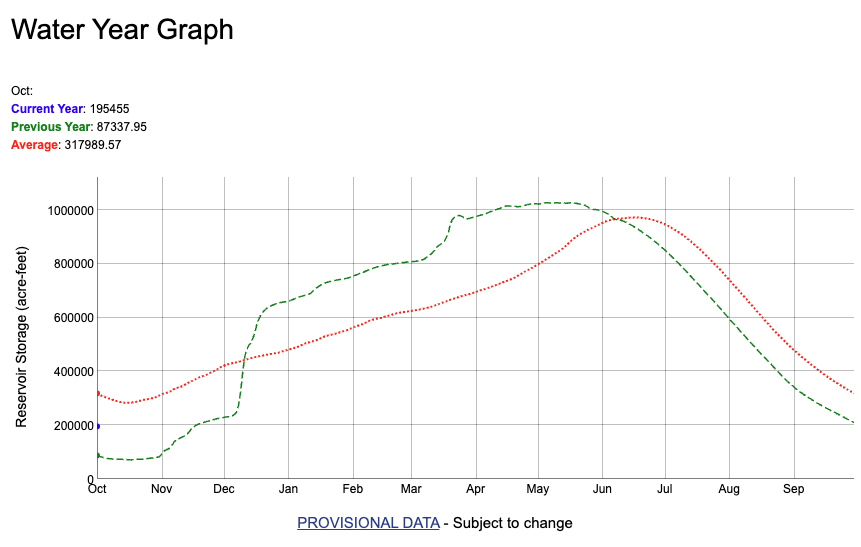 Yakima River Basin total reservoir storage through October 2, 2026. Data from the U.S. Bureau of Recreation. Note: A new water year has started. The 2026 water year which just ended is depicted here on the green dashed line. The dotted red line shows average reservoir storage. Current storage is labeled in blue on the bottom left side of the graph and current storage volume of 195,455 acre-feet is noted in the legend in the upper left.
The U.S. Drought Monitor shows some expansion of drought conditions in the northwestern Cascades due to drier than normal conditions. Drought conditions improved across the central and southern Cascades and across Yakima County thanks to beneficial rainfall. As of September 29, about 66% of the state’s land area is experiencing some level of drought conditions (D1-D4). Drought conditions are in better shape than they were this time last year with only around 25% of the state in D2-D4 drought this year compared to about 80% of the state experiencing such conditions this time last year.
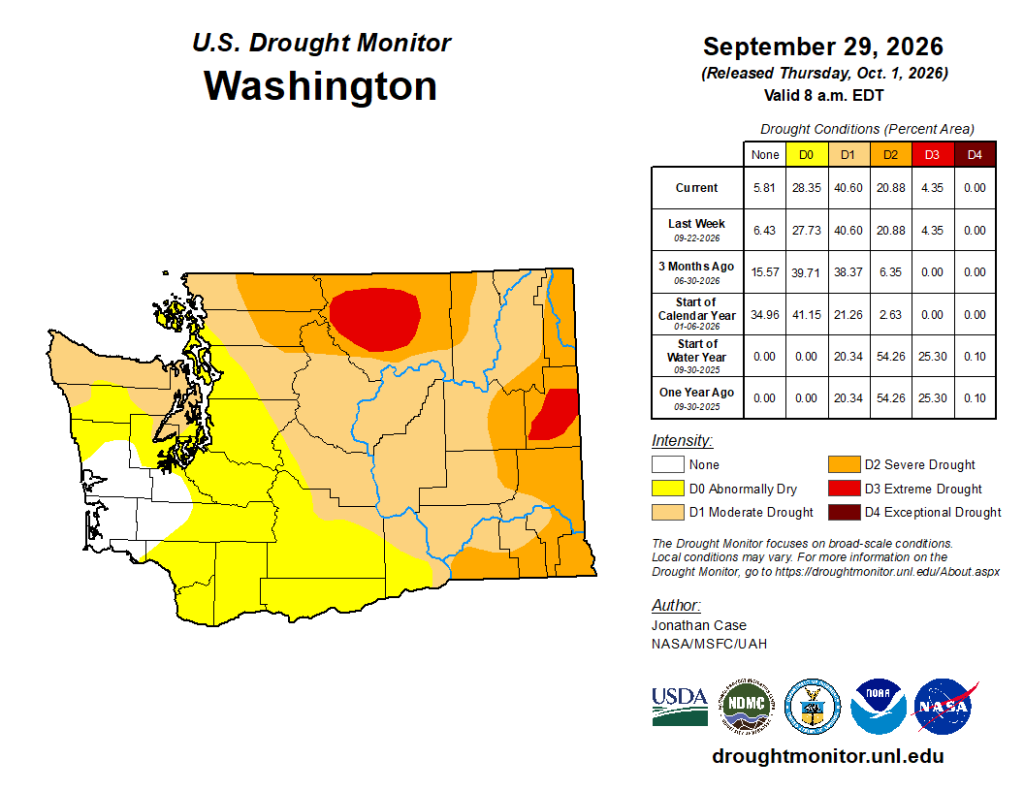 U.S. Drought Monitor for Washington. Data valid on September 29, 2026. The Table on the right shows what percentage of the state, by land area, is in each drought condition category currently and over the past year.