How do scientists develop confidence and experience having conversations with the general public around climate science, global and local impact, and solutions when their areas of expertise are in a disciplinary science such as oceanography or urban planning? In Fall 2024, the Program on Climate Change (PCC), and the Washington State Climate Office (WASCO) set out to create a training program that would help develop the capacity for graduate students to do just that, and to serve as a community resource on climate science and solutions.
If you or your organization is interested in requesting a presentation, you can find a link to a presentation request form on the PNW Climate Ambassador webpage.
In light of growing concerns for the continued availability of federal climate data and tools, we would like to point you toward an ongoing effort at UW Libraries to gather alternative links to federal climate resources and websites.
This list includes links to archived versions of government webpages (for example, via the GovWayback archive and others) as well as a section titled ‘Climate, energy, & environmental data’ which lists access links for various climate datasets and tools. This list is by no means comprehensive and is likely to expand. A wide variety of institutions and organizations, such as the Data Rescue Project (not affiliated with UW), continue to work to create new archives.
We are also in the process of identifying vulnerable climate datasets and are working to ensure continuous access to crucial climate information.
As always, if you would like assistance accessing or interpreting climate data or information, we encourage you to visit our Data and Tools Library, where this information will continue to live, contact us, or submit a data request, and we are happy to help.
July – September is likely to be warmer and drier than normal
The CPCs one month outlook for July 2025 shows elevated chances of warmer and drier than normal conditions across the state. There is a 50-60% chance of above normal temperatures across the southeast corner of the state and a slightly lower chance (40-50%) of above normal temperatures in the rest of the state. Precipitation chances are most likely to be below normal statewide, but confidence is a bit lower in the precipitation outlook compared to temperature. There is a 40-50% chance of below normal precipitation in and east of the western Cascades foothills. Far western Washington, including Puget Sound, has only a 33-40% chance of below normal precipitation.
The CPCs three month outlook for July-August-September also depicts warmer and drier than normal conditions are likely statewide. Above normal temperature chances are particularly elevated with the majority of the state showing a 50-60% chance of above normal temperatures through the rest of summer and into early autumn. Above normal temperatures will likely continue to exacerbate drought conditions. Precipitation is only marginally likely to be below normal through this period with most of the state showing a 33-40% chance of below normal precipitation. The far eastern fringes of the state, including Spokane and Pullman, have a slightly higher chance (40-50%) of below normal precipitation from July-September.
ENSO-neutral conditions continue through summer with an 82% chance that neutral conditions persist through at least August 2025. ENSO models show an 85-90% chance that either ENSO-neutral or La Niña conditions return for winter 2025-26.
In this edition of Climate Matters, we return to our Climate Division series in which we describe the local climate features in each of Washington’s 10 climate divisions, as defined by NOAA. In this installment, we will detail the climate of Washington Climate Division 9, ‘Northeast.’ To read about the other climate divisions in the state, please visit Washington’s Climate page.
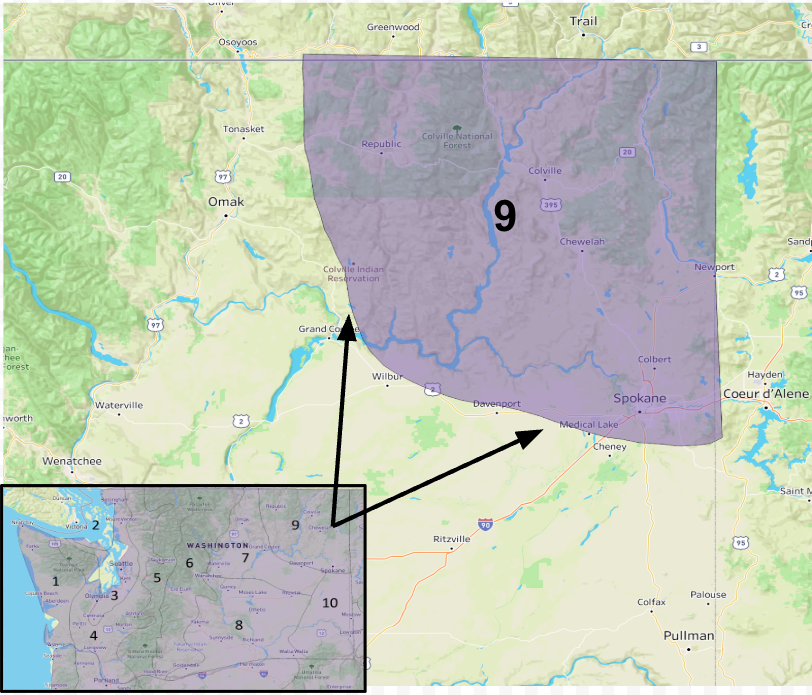
Climate Division 9 encompasses the northeastern corner of Washington. This division includes the Spokane Metropolitan area, home to around 600,000 people, as well as the communities of Chewelah, Newport, Colville, and Republic. The reservations of the Kalispel, Spokane, and Colville Tribes are also located within this Division. This region has complex, mountainous terrain with a wide elevation range from around 1,500-2,000’ on the Columbia Plateau near Spokane and along the Spokane River up to 7,000’+ in the highest peaks Selkirk and Kettle ranges in the northern half of the region. This complex terrain contributes to a wide range of climatic conditions as well as localized microclimates. Precipitation is considerably higher in the higher elevations of this region, which receive around 40-50” of rainfall annually while areas on the Plateau receive around 15-20” per year.
Climate Division 9: ‘Northeast,’ overlaid onto a topographical map.
This graph, known as a climograph, depicts monthly average precipitation and minimum and maximum temperatures, averaged over the entire climate division area from 1991-2020. Like the rest of the state, precipitation is most abundant during the cool season with November through January representing the wettest months of the year. In western Washington, precipitation steadily declines through spring as more frequent high pressure over the region tends to send storms further northward. However, northeastern Washington receives more spring precipitation as moisture is occasionally brought up from the interior United States in late Spring. This springtime pattern is more characteristic of the northern Rocky Mountain region of the United States where May and June tend to be the wettest months. We can see this pattern in Climate Division 9’s climograph because precipitation in March through June remains relatively steady. As is characteristic for the rest of the state, precipitation then drops off considerably from July-September when high pressure tends to dominate our region.
Climograph of monthly average minimum temperature, maximum temperature, and precipitation for Climate Division 9.
Despite these generally dry summers, strong summertime surface heating combined with complex terrain can create convective showers and thunderstorms that bring localized heavier precipitation. As a result, this corner of the state is among the most lightning-prone in the state. These lightning strikes can also serve as ignition points for wildfires in the region. Although severe weather is rare, thunderstorms have produced pocket change sized hail and damaging winds in the region. On June 5th, 2005 thunderstorms produced a gust to 77 mph in Spokane and numerous gusts above 50 mph.
A table, courtesy of the NWS Spokane Office, showing the highest gusts recorded from a thunderstorm complex on June 5th, 2005.
In the summer, temperatures can get quite warm in the lower elevations in the region, often reaching into the 90s and above 100°F in Spokane around once or twice per year in the present climate. In the winter, the Columbia Plateau and mountain valleys within this division are notorious for persistent fog. This fog can stick around for days and even weeks on end, only lifting briefly in the afternoons. When temperatures drop below freezing, fog can freeze on surfaces and cause travel disruptions region-wide. Non-thunderstorm winds can also be strong across the Plateau, mainly in the cool season when the cold fronts that often drive these strong winds are more common. These winds are also prone to the effects of the terrain. In particular, during many cold-air outbreaks the low-level flow accelerates down the Purcell Trench, a north-south oriented valley from Canada to about Coeur D’Alene, Idaho that then turns towards Spokane. Spokane Valley represents the exit of this gap, resulting in locally-enhanced wind speeds.
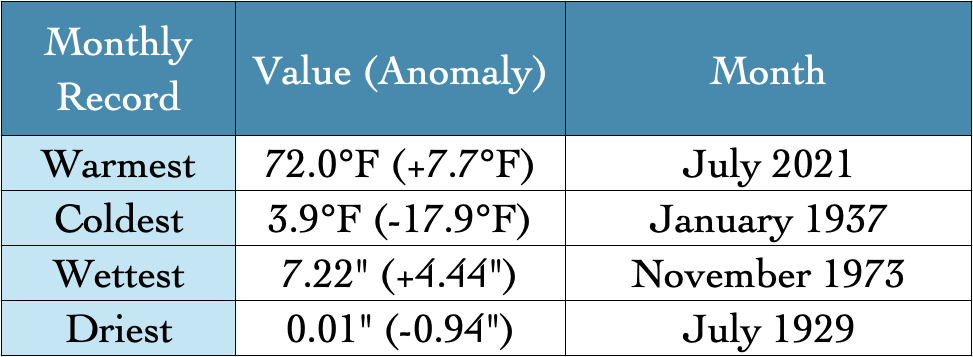
The warmest month since 1895 in Climate Division 9 occurred in July 2021 with a monthly average temperature of 72°F, +7.7°F above normal. Spokane International Airport, one of the oldest continuous climate stations in the state, also set the record for the most number of days above 90°F in a single July (22 days) in July 2021. The coldest month since 1895 for Climate Division 9 was January 1937 when the average temperature was just 3.9°F for the month. This was an impressive anomaly of 17.9°F below normal, and Spokane Airport set a January record of 23 days in which the maximum daytime temperature was below 20°F.
Table of the warmest, coldest, wettest, and driest month on record from 1895-2024.
The wettest month on record occurred in November 1973 with an average of 7.22” of rainfall across the division. The driest month on record occurred in July of 1929 when an average of only 0.01” of rainfall fell. July 1929 was a particularly dry year across the western and central United States and is often noted as the beginning of the 1930s United States dust bowl in the central and southern plains.
This division has also seen a steady warming trend since 1895. Temperatures have risen at a rate of about 1.5°F per century during this time period which is just below the statewide rate of about 1.7°F per century over this same period.
Graph of Average Annual Temperatures in Climate Division 9 from 1895-2024.
There is also a slight increase in annual precipitation since 1895, but this trend is not statistically significant. This slight trend is also likely affected by variations that are not related to climate change, such as the notable dry period in the 1910s through the 1930s. This is a good reminder that in this climate division as well as in much of the rest of the state, year-to-year variability in annual precipitation remains larger than long term changes in annual precipitation due to climate change.
Graph of Average Total Precipitation in Climate Division 9 from 1895-2024.
In summary, Washington’s Northeastern Climate Division has a more continental climate typical of eastern Washington, with hot summers and cold winters. Echoing the pattern in the Rocky Mountain foothills, it has wetter springs than western Washington, but dry summers as in the rest of the state. This Climate Division’s complex topography also leads to large variations in temperature and precipitation as well as unique climate features. North-south oriented valleys allow for cold air to filter in from Canada and the interior Rockies in the winter, and fog is often persistent and dense during winter in the mountain valleys and Columbia Plateau.
Do you have feedback on our Climate Division series? Contact us or follow us on X or Bluesky.
Considerable snowmelt continued through May as warm and dry conditions continued in the mountains. The difference in snowpack coverage can be seen clearly by comparing maps of May 1 and June 1 SWE, courtesy of the National Operational Hydrologic Remote Sensing Center (NOHRSC). The Blue Mountains in southeastern Washington and the Okanogan Highlands/Rockies in northeastern Washington have almost completely melted out as of June 1. Most middle and lower elevation locations in the Cascades and the Olympics have also melted out.
Snow Water Equivalent (SWE) as of May 1, 2025 (left) and June 1, 2025 (right).
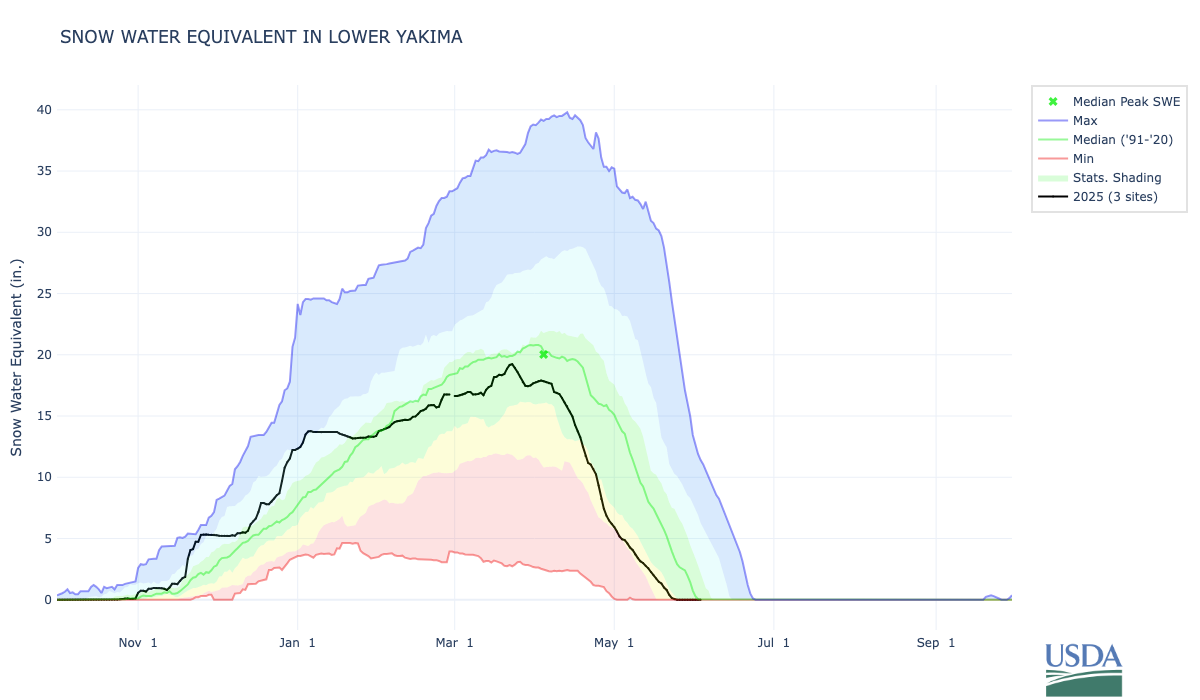
A SWE graph of the Lower Yakima Basin shows this earlier than normal melt. The SNOTEL monitoring sites for the Lower Yakima Basin reached 0.0” snow water equivalent a little over a week before the 1991-2020 median date. Most basins in the state are on track to melt out around 1-2 weeks earlier than normal, with some of the individual sites melting 2-4 weeks earlier than normal.
Snow water equivalent for Lower Yakima Basin SNOTEL sites.
Our precipitation deficit and dwindling snowpack have also led to below normal streamflow across much of the state, especially in the Cascades, the Olympic Peninsula, and notably the Yakima River, as seen in orange and brick red shading on the USGS streamflow map.
Streamflow as percent of normal, averaged by hydrologic unit for the 28-day period ending on June 1, 2025.
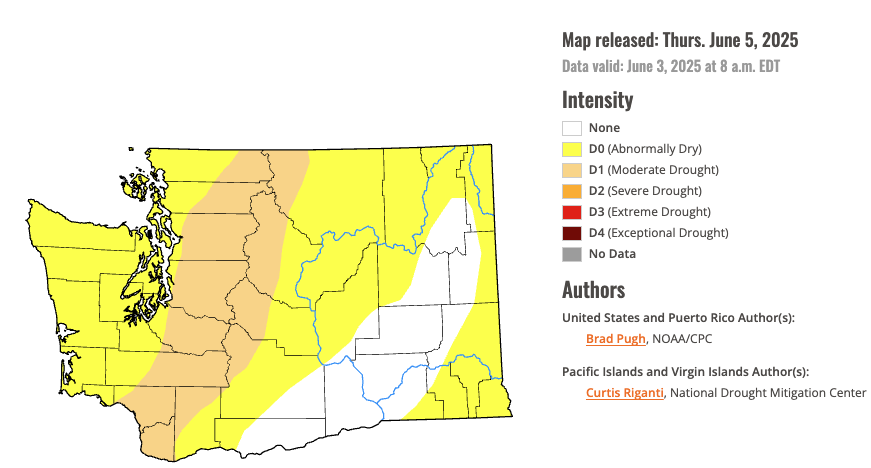
According to the U.S. Drought Monitor, Moderate Drought (D1) conditions continue in much of the Cascade Mountains and western Cascade Foothills and expanded into the southern I-5 Corridor near Castle Rock and Vancouver. These drought conditions will persist through June and are likely to persist through at least August 2025. Abnormally dry conditions continue across the rest of western Washington and have also expanded further into portions of the western Columbia Plateau, the Okanogans, and the Blue Mountains.
ENSO-neutral conditions are very likely (74% chance) to continue through the summer according to the Climate Prediction Center (CPC). Neutral conditions typically do not play a large role in determining our average summer weather so the outlooks elaborated on below are determined mostly from seasonal forecast models.
The 1-month outlook from the CPC for June 2025 indicates increased chances of below normal precipitation across eastern Washington (40-50%) and to a lesser extent, western Washington (33-40%). June temperatures are expected to be above normal statewide. The highest chances of above-normal temperatures exist across southeastern Washington (50-60%) near Walla Walla, Pomeroy, and Pullman with slightly less confidence in above normal temperatures across northwestern Washington (33-40%) including the Olympic Peninsula and Puget Sound.
1-month (June) outlook for precipitation (left) and temperature (right) in Washington State.
Regarding the 3-Month outlook (June-July-August), the overall weather is most likely to be drier and warmer than normal through the summer. There is a 40-50% chance that precipitation will be below normal statewide. Temperature shows a similar pattern to the 1-month outlook with the highest chance (50-60%) of above normal temperatures across southeastern Washington while the rest of the state has a 40-50% chance of above normal temperatures. These outlooks intensify drought concerns due to earlier than normal snowmelt for major river basins through June and increased water and electricity demands through the summer months.
Observed daily high and low temperatures (dark bars) as well as records and normals (background shading) for SeaTac Airport. Data unavailable beginning May 27.
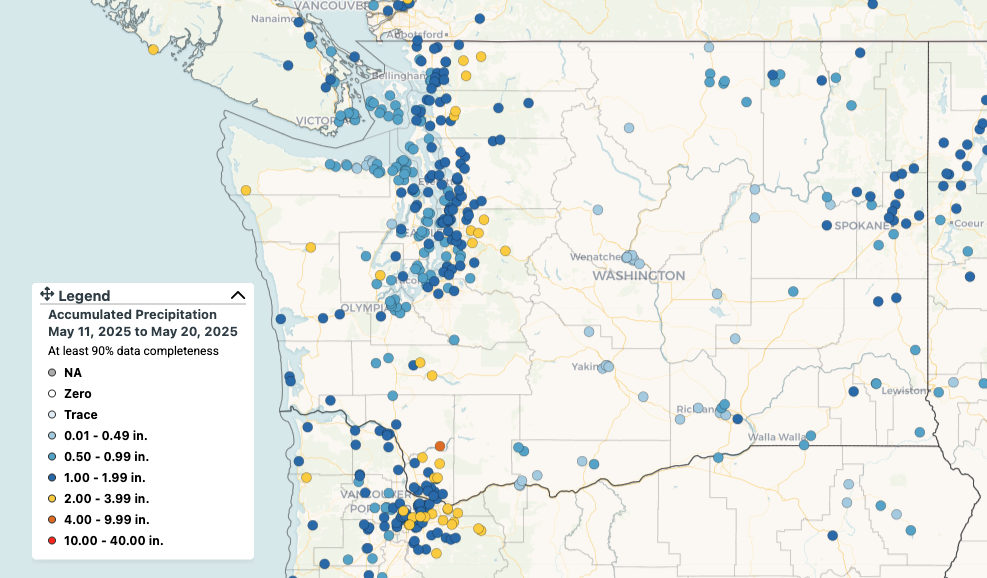
May 2025 featured near normal temperatures statewide, aside from some notable warm spells, and below normal rainfall when averaged statewide. The majority of the month’s rainfall occurred during a more active period of weather from May 11-20. The CoCoRaHS network precipitation map shows total rainfall for this period across the state with the highest station totals (2”+) in the foothills of the Cascades and Olympics. 1.00-2.00” of rain fell on the eastern side of Puget Sound and near Spokane. Most of the leeward (eastern) side of the Cascades received very little precipitation during this more active period and for the month as a whole (see the May 2025 Climate Summary for more details).
Statewide rainfall totals from May 11-20, 2025 as recorded by CoCoRaHS network stations.
Temperatures were slightly cooler than normal during this rainy period, but not cool enough to offset notable warm periods toward the beginning and end of the month. On May 1 temperatures across western Washington climbed into the mid to upper 70s in central Puget Sound and into the lower 80s across the Chehalis Basin. On May 2, cooler onshore flow returned to western Washington and the warmest temperatures shifted to the eastern half of the state. Temperatures in eastern Washington rose into the mid to upper 80s in the Columbia Basin, and Walla Walla Regional Airport set a daily record of 86°F beating the previous daily record of 82°F set on May 2, 2016. Warmth returned briefly across the state on the 6th-8th as onshore flow waned, then temperatures moderated to near or just below normal through the middle portion of the month.
Maximum temperature on May 28th, 2025. Data from PRISM. Map created using SC ACIS.
A ridge of high pressure then began to build again across the state on May 24. Temperatures warmed over the next few days, and peaked for much of the state on May 28. Temperatures soared into the lower to mid-80s across Puget Sound, and easterly downsloping winds allowed for locally higher temperatures along eastern foothills of the Cascades with numerous readings near 90°F. Meanwhile, in eastern Washington, temperatures rose into the 90s including 91°F in Yakima and 93°F at Spokane Felts Field Airport on May 28.
In the evening and overnight hours of May 29, an onshore push of cooler air brought a brief reprieve from warm temperatures for western Washington. Heat continued to build again in eastern Washington through the end of the month. The Pasco Airport briefly reached 95°F on the afternoon of May 31 and the nearby Richland Airport recorded a daily high temperature of 97°F. This represents the highest reliable temperature recording in Washington State so far this year, as of May 31. In the late afternoon of the 31st, a cold front moved in from western Washington and brought strong winds to the eastern slopes of the Cascades. A station near Ellensburg, located in the wind-prone Kittitas Valley, recorded a gust to 59 mph with gusts of 45-55 mph elsewhere in the Columbia Plateau. Blowing dust was also widespread due to the recent dry conditions and strong winds, and temperatures dropped 15-20 degrees in just a couple of hours as the front passed through.
May was another dry month for nearly all portions of the state and ranked as the 26th driest May statewide since 1895. On the heels of dry and warm conditions in April, concerns continue to grow for worsening drought conditions as we head into summer 2025. Our April-May 2025 period now ranks as the 13th driest such period on record since 1895.
May precipitation as a percent of 1991-2020 normal (left) and May Average Temperature anomaly compared to 1991-2020 mean (right).
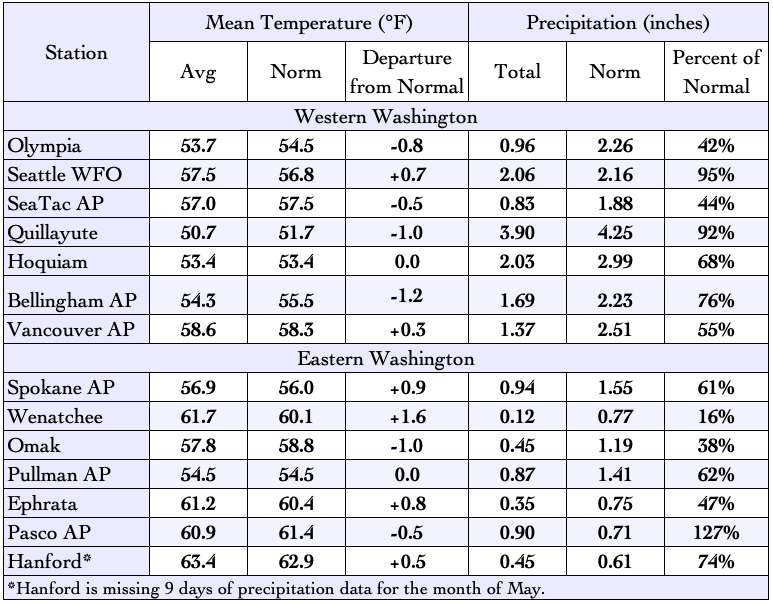
Similar to April, the east slopes of the Cascades from Omak south through Yakima saw the lowest precipitation totals relative to normal in the state with many spots seeing less than 30% of normal precipitation. Omak received only 38% of normal precipitation and Wenatchee received only 16% of normal. Elsewhere in eastern Washington, precipitation was around 40-70% of normal including 61% of normal in Spokane and 47% of normal in Ephrata. A few very isolated spots near the Tri-Cities received near or just above normal precipitation. Across western Washington, precipitation was around 40-90% of normal for the month with the largest deficits across the southern Puget Sound (42% of normal precipitation at Olympia and the 18th driest May on record) and south toward Vancouver, WA (55% of normal precipitation). SeaTac Airport also recorded below normal precipitation with only 44% of normal and ranking as the 12th driest May on record.
May 2025 climate summaries for locations around Washington. Anomalies are relative to a climate normal baseline of 1991-2020.
Daily averaged temperatures for May were near normal with a slight warm anomaly of 0.3°F statewide compared to 1991-2020 normal period. May 2025 ranks as the 38th warmest May in Washington since 1895. The largest temperature anomalies occurred on the eastern slopes of the Cascades where temperatures ran 2-4°F above normal. Across eastern Washington, temperatures ran within 1°F of normal. Temperatures were slightly above normal at Spokane (+0.9°F), and Ephrata (+0.8°F). A few stations in low-lying valleys such as Omak (-1.0°F) and Pasco (-0.5°F) saw slightly below normal temperature anomalies. Across western Washington, anomalies were also generally near normal with some stations such as Bellingham (-1.2°F) and Olympia (-0.8°F) recording slightly below normal temperatures while others such as Seattle WFO (+0.7°F) and Vancouver AP (+0.3°F) recorded slightly above normal temperatures.
It is interesting to note that due to extended stretches of fair weather and clear nighttime skies during May, nighttime lows were consistently below normal across portions of the state that tend to cool more efficiently on clear nights. These areas include lowland areas around Puget Sound, the Chehalis Basin, low-lying portions of the Columbia and Snake River basins as well as mountain valleys where cool air tends to pool. In comparison, daytime highs showed more consistent and even warm anomalies statewide. This unevenness in nighttime cooling across the state was a major factor in the localized areas of cool mean temperature anomalies relative during May.